Question 13 (12 marks):
(a) Diagram 9.1 shows point P (5, 1) on a Cartesian plane.
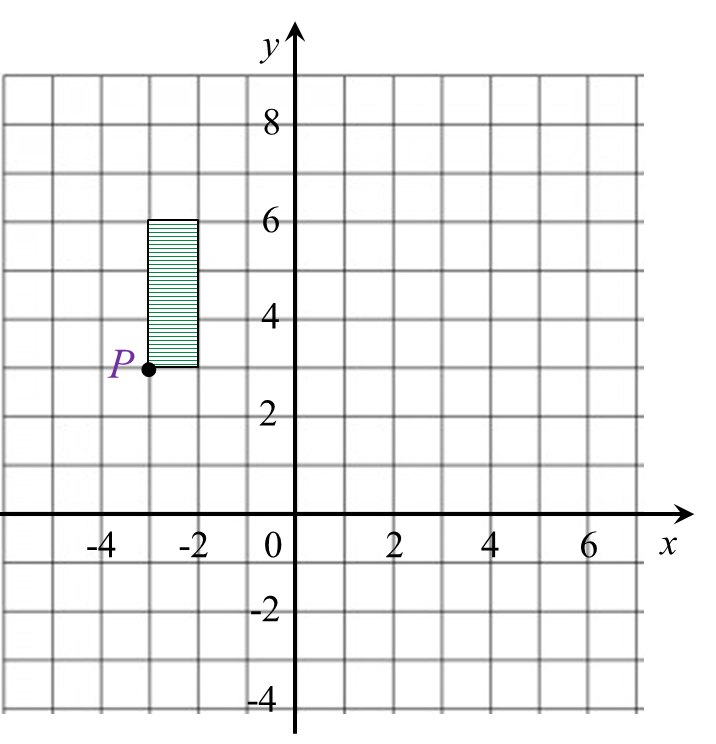 Diagram 9.1
Transformation T is a translation
Transformation S is an enlargement about the centre (–5, 2) with a scale factor 2.
State the coordinates of the image of point P under the following transformations:
(i) T2,
(ii) TS.
(b) Diagram 9.2 shows geometrical shapes KLMNP, KSRQP and KTUVW drawn on a Cartesian plane.
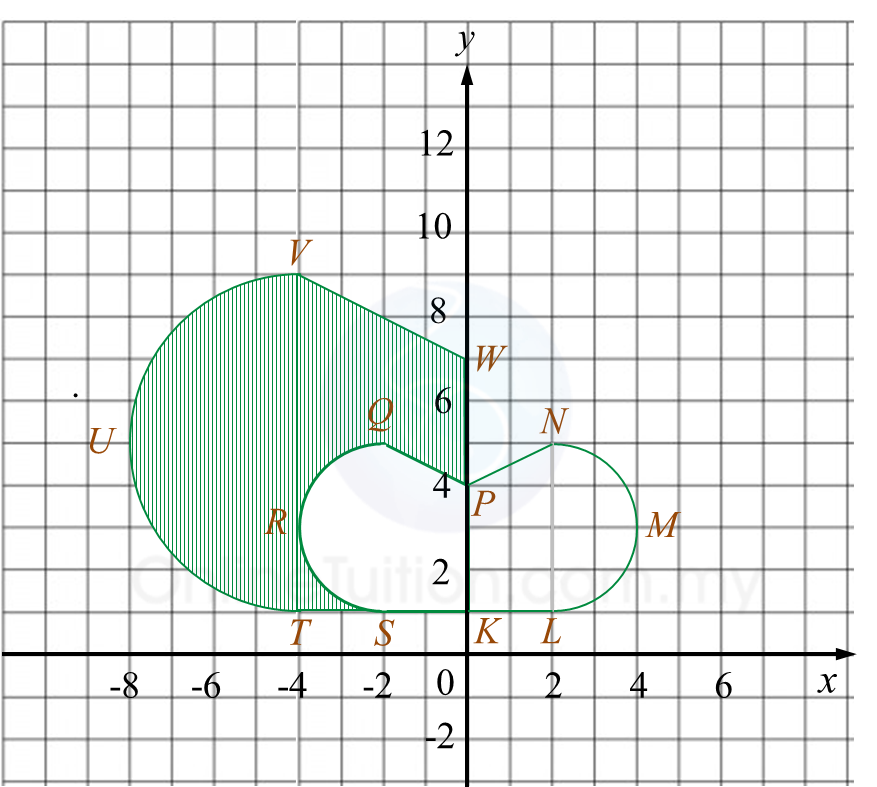 Diagram 9.2
(i) KTUVW is the image of KLMNP under the combined transformation YZ.
Describe, in full, the transformation:
(a) Z,
(b) Y.
(ii) It is given that KSRQP represents a region of area 30 m2.
Calculate the area, in m2, of the shaded region.
Solution:
(a)
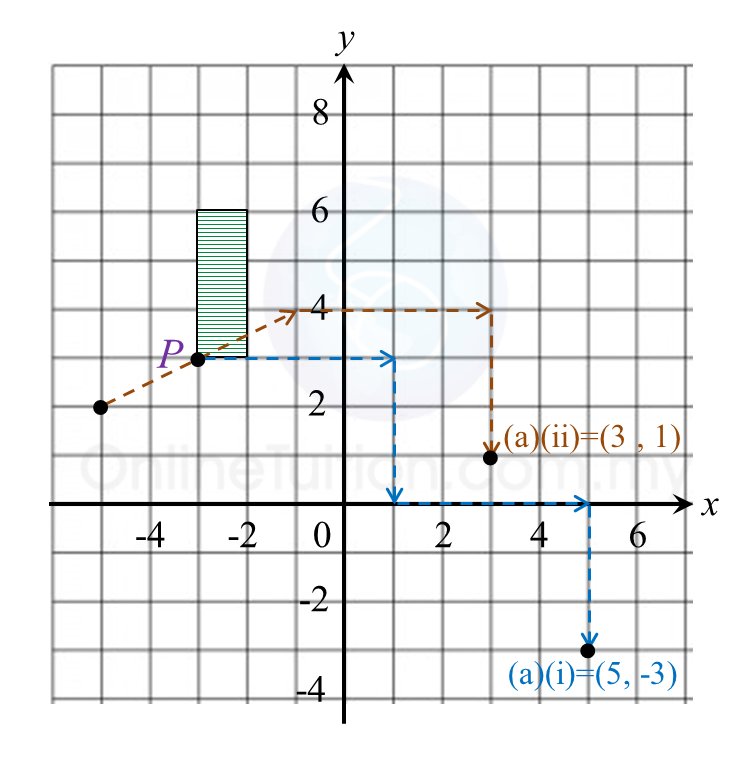
(i) TT = P(–3, 3) → T1 → P’(1, 0) ) → T2 → P’’(5, –3)
(ii) TS = P (–3, 3) → S → P’(–1, 4) → T → P’’(3, 1)
(b)(i)(a)
Z: Reflection in the line x = 0.
(b)(i)(b)
Y: Enlargement with the centre at (0, 0) and a scale factor of 2.
(b)(ii)
Area of KTUVW = (Scale factor)2 × Area of object
= 22 × 30
= 120 m2
Hence,
Area of shaded region
= Area KTUVW – Area KSRQP
= 120 – 30
= 90 m2
(a) Diagram 9.1 shows point P (5, 1) on a Cartesian plane.
Diagram 9.1Transformation T is a translation
Transformation S is an enlargement about the centre (–5, 2) with a scale factor 2.
State the coordinates of the image of point P under the following transformations:
(i) T2,
(ii) TS.
(b) Diagram 9.2 shows geometrical shapes KLMNP, KSRQP and KTUVW drawn on a Cartesian plane.
Diagram 9.2(i) KTUVW is the image of KLMNP under the combined transformation YZ.
Describe, in full, the transformation:
(a) Z,
(b) Y.
(ii) It is given that KSRQP represents a region of area 30 m2.
Calculate the area, in m2, of the shaded region.
Solution:
(a)
(i) TT = P(–3, 3) → T1 → P’(1, 0) ) → T2 → P’’(5, –3)
(ii) TS = P (–3, 3) → S → P’(–1, 4) → T → P’’(3, 1)
(b)(i)(a)
Z: Reflection in the line x = 0.
(b)(i)(b)
Y: Enlargement with the centre at (0, 0) and a scale factor of 2.
(b)(ii)
Area of KTUVW = (Scale factor)2 × Area of object
= 22 × 30
= 120 m2
Hence,
Area of shaded region
= Area KTUVW – Area KSRQP
= 120 – 30
= 90 m2
Question 14 (12 marks):
Diagram 10 shows the marks obtained by a group of 36 students in a Mathematics test.
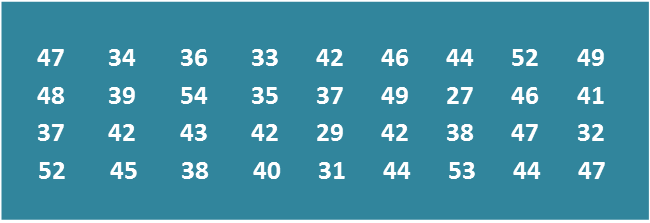 Diagram 10
(a) Based on the data in Diagram 10, complete Table 3 in the answer space.
(b) Based on Table 3, calculate the estimated mean mark of a student.
(c) For this part of the question, use graph paper.
By using the scale of 2 cm to 5 marks on the horizontal axis and 2 cm to 1 student on the vertical axis, draw a frequency polygon for the data.
(d) Based on the frequency polygon in 14(c), state the number of students who obtained more than 40 marks.
Answer:
 Table 3
Solution:
(a)

(b)
(c)

(d)
Number of students who obtained more than 40 marks
= 10 + 8 + 4
= 22 students
Diagram 10 shows the marks obtained by a group of 36 students in a Mathematics test.
Diagram 10(a) Based on the data in Diagram 10, complete Table 3 in the answer space.
(b) Based on Table 3, calculate the estimated mean mark of a student.
(c) For this part of the question, use graph paper.
By using the scale of 2 cm to 5 marks on the horizontal axis and 2 cm to 1 student on the vertical axis, draw a frequency polygon for the data.
(d) Based on the frequency polygon in 14(c), state the number of students who obtained more than 40 marks.
Answer:
Table 3Solution:
(a)
(b)
(c)
(d)
Number of students who obtained more than 40 marks
= 10 + 8 + 4
= 22 students