Question 14:
Diagram 8 is an ogive showing the amount of money, in RM, spent on petrol in a month by a group of motorcycle riders.

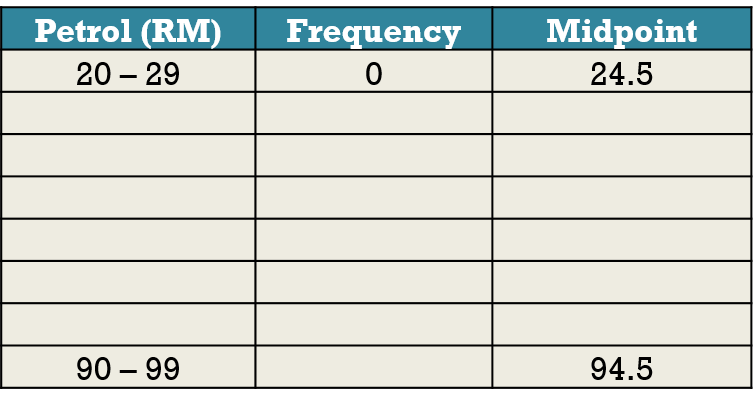
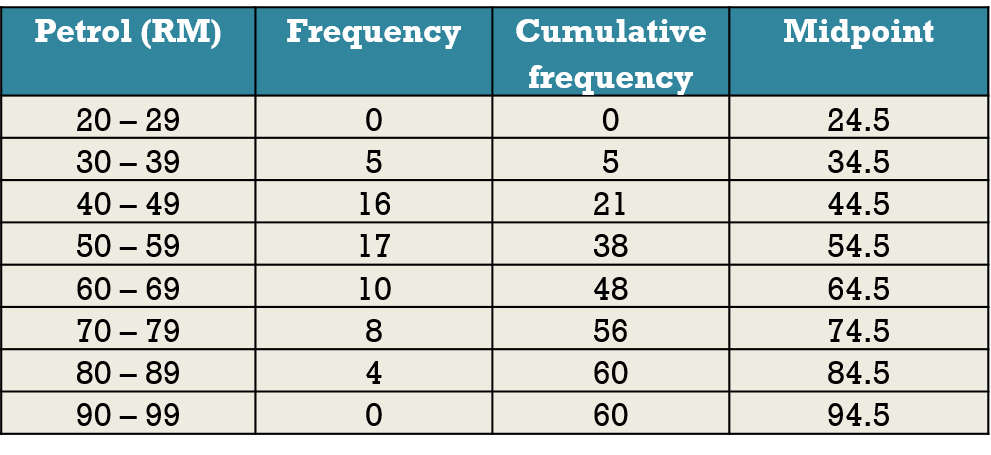
(a) Based on Diagram 8, complete Table 3 in the answer space. [4 marks]
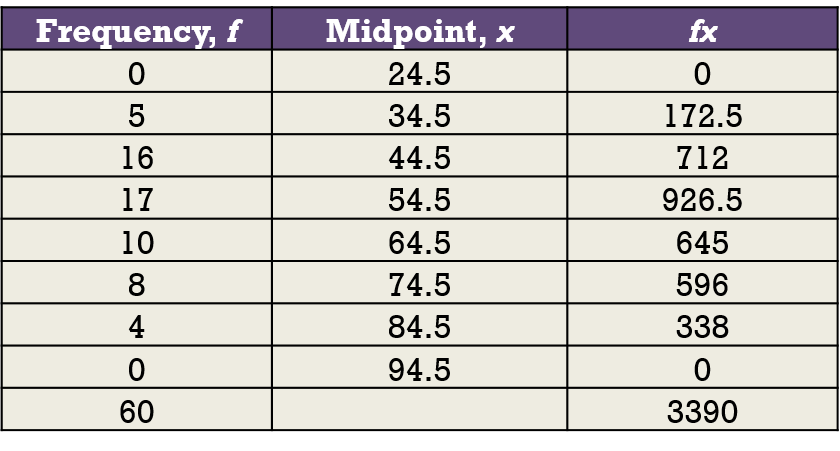
(b) Based on Table 3, calculate the estimated mean amount of money, in RM, spent by a motorcycle rider. [3 marks]
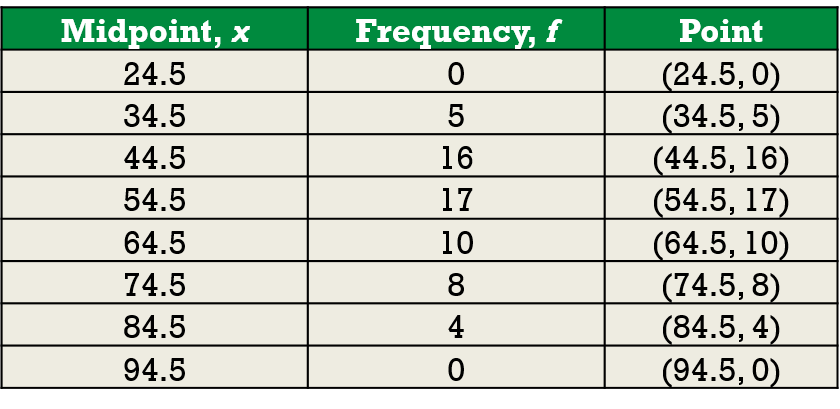
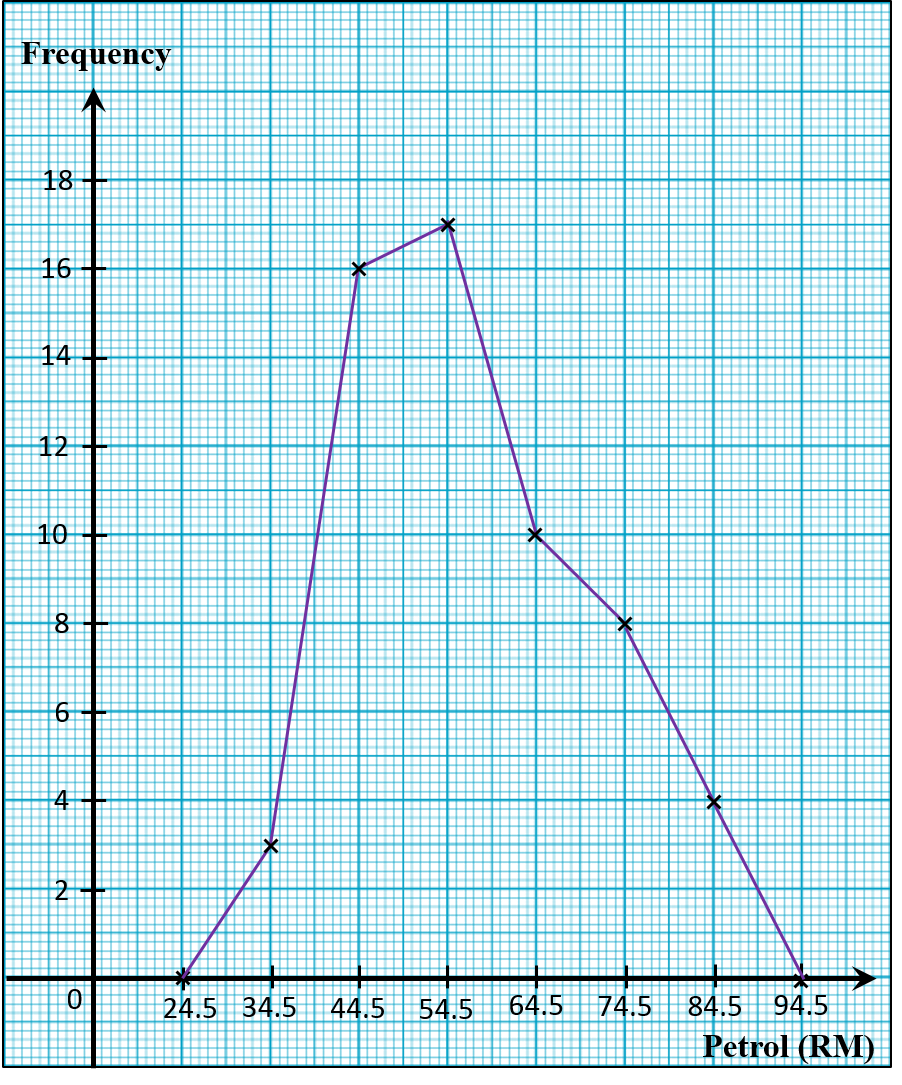
(c) Draw a frequency polygon for the data, using the scale of 2 cm to RM 10 on the horizontal axis and 2cm to 2 motorcycle riders on the vertical axis. [4 marks]
(d) Based on the frequency polygon in 14 (c), state the percentage of the motorcycle riders who spent more than RM70 on petrol. [1 mark]
Answer:
Solution:
(a)
(b)
(c)
(d)
Diagram 8 is an ogive showing the amount of money, in RM, spent on petrol in a month by a group of motorcycle riders.

(a) Based on Diagram 8, complete Table 3 in the answer space. [4 marks]
(b) Based on Table 3, calculate the estimated mean amount of money, in RM, spent by a motorcycle rider. [3 marks]
(c) Draw a frequency polygon for the data, using the scale of 2 cm to RM 10 on the horizontal axis and 2cm to 2 motorcycle riders on the vertical axis. [4 marks]
(d) Based on the frequency polygon in 14 (c), state the percentage of the motorcycle riders who spent more than RM70 on petrol. [1 mark]
Answer:

Solution:
(a)


(c)


(d)