Question 13 (12 marks):
(a) Diagram 7.1 shows K (5, 1) drawn on a Cartesian plane.
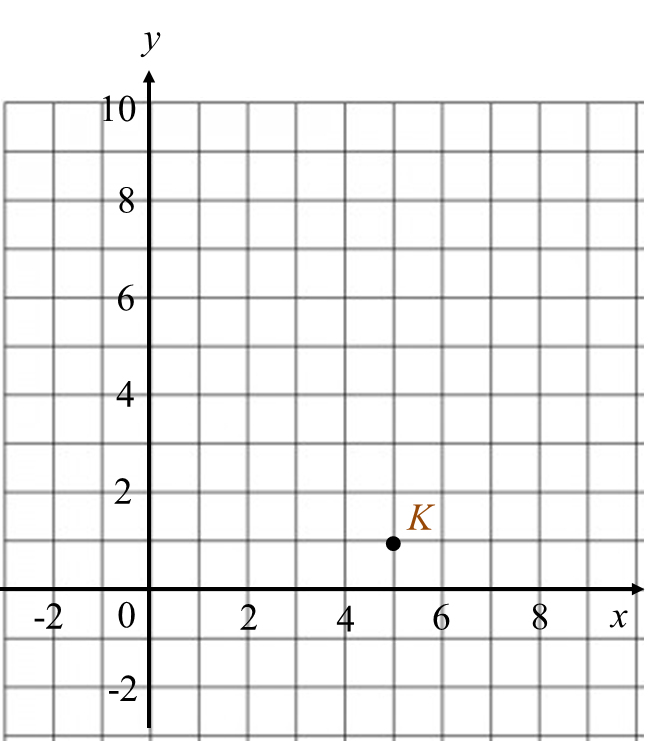 Diagram 7.1
Transformation T is a translation
Transformation P is a reflection in the line y = 2.
State the coordinates of the images of point K under each of the following transformations:
(i) T2,
(ii) TP.
(b) Diagram 7.2 shows two pentagons KLMNP and QRSTU, drawn on a Cartesian plane.
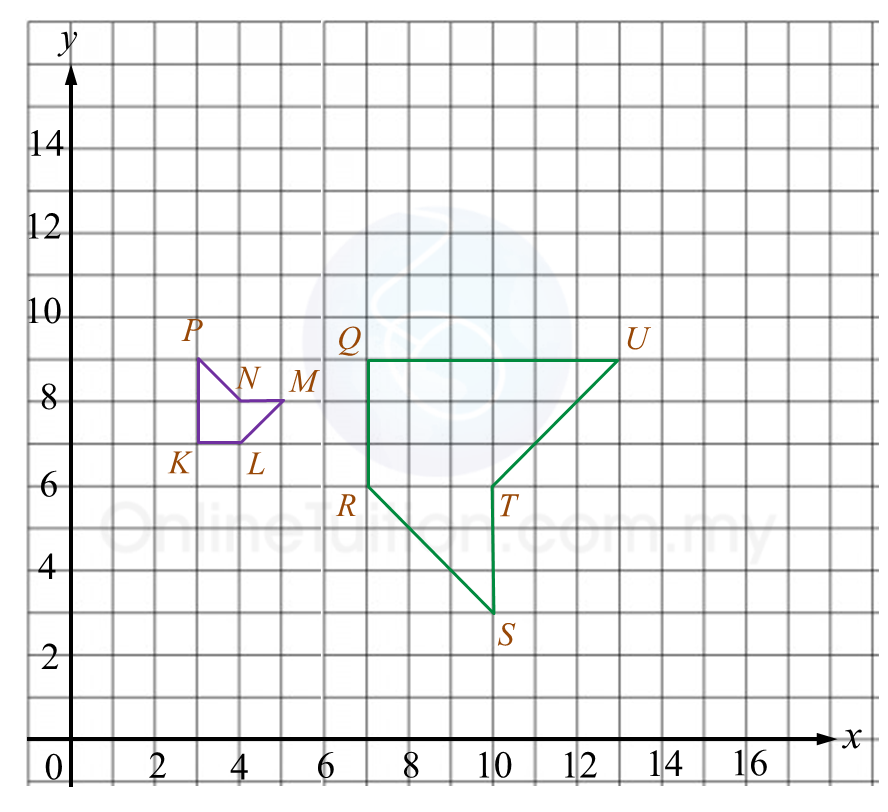 Diagram 7.2
(i) Pentagon QRSTU is the image of pentagon KLMNP under the combined transformation WV.
Describe in full the transformation:
(a) V,
(b) W.
(ii) It is given that pentagon QRSTU represents a region with an area of 90 m2.
Calculate the area, in m2, of pentagon KLMNP.
Solution:
(a)
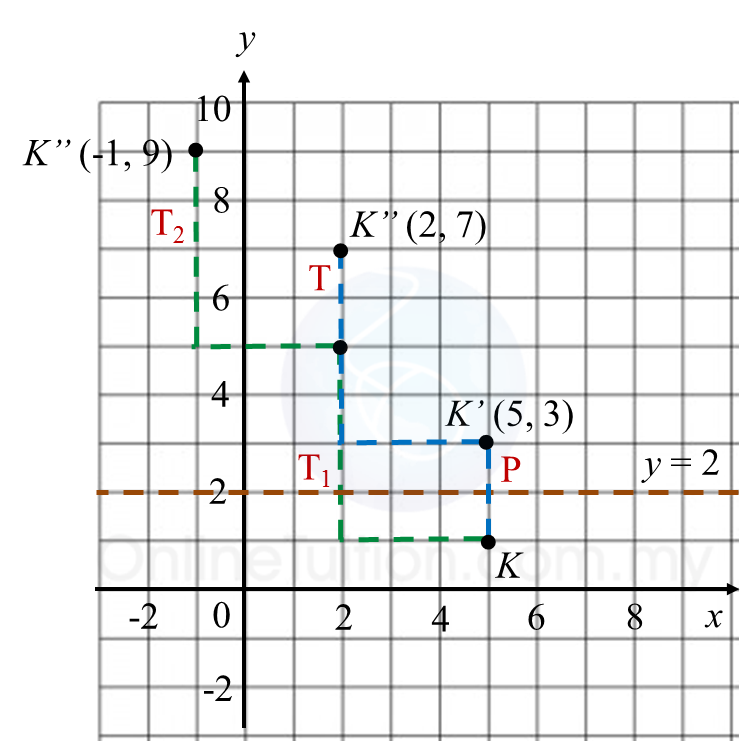
(i) TT = K(5, 1) → T1 → K’(2, 5) ) → T2 → K’’(–1, 9)
(ii) TP = K(5, 1) → P → K’(5, 3) → T → K’’(2, 7)
(b)
(b)(i)(a)
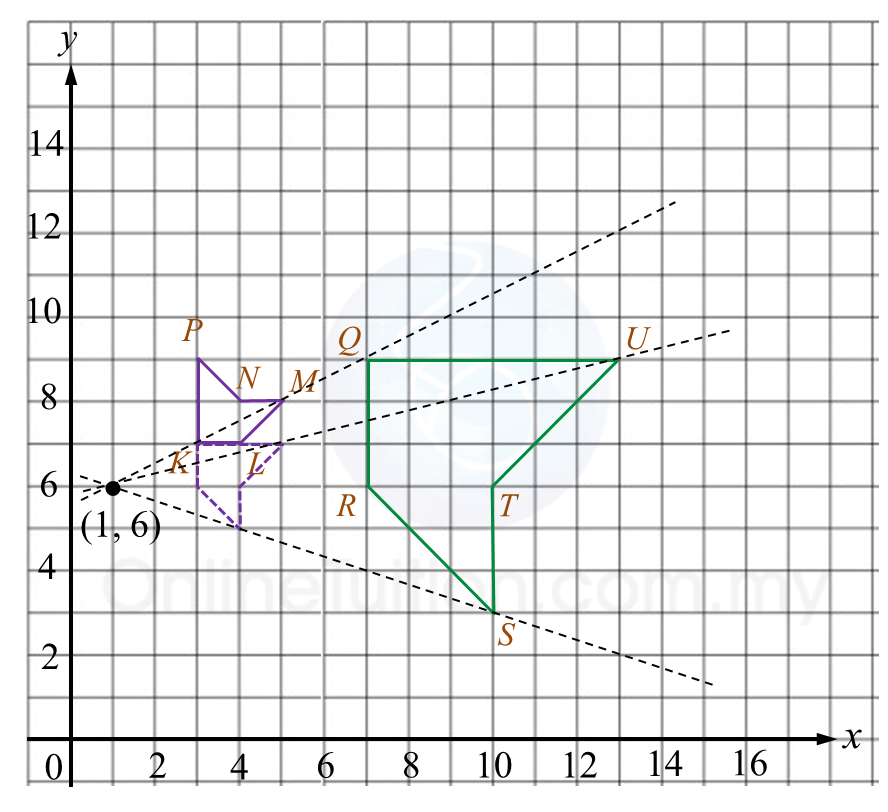
V: 90o rotation in clockwise direction at point K(3, 7).
(b)(i)(b)
W: Enlargement at point (1, 6) with scale factor 3.
(b)(ii)
Area of QRSTU = (scale factor)2 × area of object
Area of QRSTU = 32 × Area of KLMNP
90 m2 = 9 × Area of KLMNP
Area of KLMNP = 90/9 = 10 m2
(a) Diagram 7.1 shows K (5, 1) drawn on a Cartesian plane.
Diagram 7.1Transformation T is a translation
Transformation P is a reflection in the line y = 2.
State the coordinates of the images of point K under each of the following transformations:
(i) T2,
(ii) TP.
(b) Diagram 7.2 shows two pentagons KLMNP and QRSTU, drawn on a Cartesian plane.
Diagram 7.2(i) Pentagon QRSTU is the image of pentagon KLMNP under the combined transformation WV.
Describe in full the transformation:
(a) V,
(b) W.
(ii) It is given that pentagon QRSTU represents a region with an area of 90 m2.
Calculate the area, in m2, of pentagon KLMNP.
Solution:
(a)
(i) TT = K(5, 1) → T1 → K’(2, 5) ) → T2 → K’’(–1, 9)
(ii) TP = K(5, 1) → P → K’(5, 3) → T → K’’(2, 7)
(b)
(b)(i)(a)
V: 90o rotation in clockwise direction at point K(3, 7).
(b)(i)(b)
W: Enlargement at point (1, 6) with scale factor 3.
(b)(ii)
Area of QRSTU = (scale factor)2 × area of object
Area of QRSTU = 32 × Area of KLMNP
90 m2 = 9 × Area of KLMNP
Area of KLMNP = 90/9 = 10 m2
Question 14 (12 marks):
The data in Diagram 8 shows the mass, in g, of 30 strawberries plucked by a tourist from a farm.
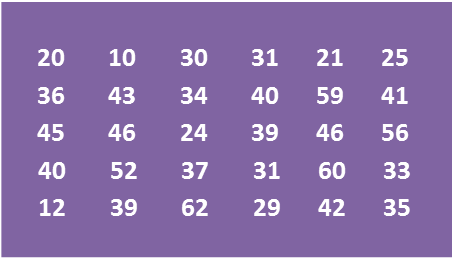 Diagram 8
(a) Based on the Diagram 8, complete Table 3 in the answer space.
(b) Based on Table 3, calculate the estimated mean mass of a strawberry.
(c) For this part of the question, use graph paper.
By using the scale of 2 cm to 10 g on the horizontal axis and 2 cm to 1 strawberry on the vertical axis, draw a histogram for the data.
(d) Based on the histogram drawn in 14(c), state the number of strawberries with the mass of more than 50 g.
Answer:

Solution:
(a)

(b)
(c)

(d)
Number of strawberries with the mass more than 50 g
= 3 + 2
= 5
The data in Diagram 8 shows the mass, in g, of 30 strawberries plucked by a tourist from a farm.
Diagram 8(a) Based on the Diagram 8, complete Table 3 in the answer space.
(b) Based on Table 3, calculate the estimated mean mass of a strawberry.
(c) For this part of the question, use graph paper.
By using the scale of 2 cm to 10 g on the horizontal axis and 2 cm to 1 strawberry on the vertical axis, draw a histogram for the data.
(d) Based on the histogram drawn in 14(c), state the number of strawberries with the mass of more than 50 g.
Answer:
Solution:
(a)
(b)
(c)
(d)
Number of strawberries with the mass more than 50 g
= 3 + 2
= 5