Question 8:
The data in Diagram 8 shows the weight of meat, in kg, sold each day over 40 days.
Diagram 8
The data in Diagram 8 shows the weight of meat, in kg, sold each day over 40 days.
| 36 | 63 | 43 | 47 | 67 | 71 | 68 | 79 | 92 | 49 |
| 41 | 52 | 66 | 78 | 84 | 55 | 77 | 86 | 58 | 94 |
| 60 | 74 | 73 | 62 | 56 | 68 | 46 | 35 | 72 | 68 |
| 80 | 40 | 57 | 59 | 71 | 81 | 92 | 60 | 63 | 53 |
(a) Based on the data in Diagram 9, complete Table 14 in the answer space. [ 4 marks]
(b) Based on Table 2, calculate the estimated mean of the weight of meat sold over 40 days. [3 marks]
(c) For this part of question, use the graph paper provided on page. By using the scale of 2 cm to 10 kg on the horizontal axis and 2 cm to 1 day on the vertical axis, draw a histogram for the data. [4 marks]
(d) Based on the histogram in 8(c), state one information about the weight of meat sold each day. [1 mark]
Answer:
(a)
Weight (kg) |
Mid point |
Frequency |
30 – 39 |
||
Table 2
Solution:
(b)
(d)
Solution:
(a)
Weight (kg) |
Mid point (x) |
Frequency (f) |
30 – 39 |
34.5 |
2 |
40 – 49 |
44.5 |
6 |
50 – 59 |
54.5 |
7 |
60 – 69 |
64.5 |
10 |
70 – 79 |
74.5 |
8 |
80 – 89 |
84.5 |
4 |
90 – 99 |
94.5 |
3 |
(b)
(c)
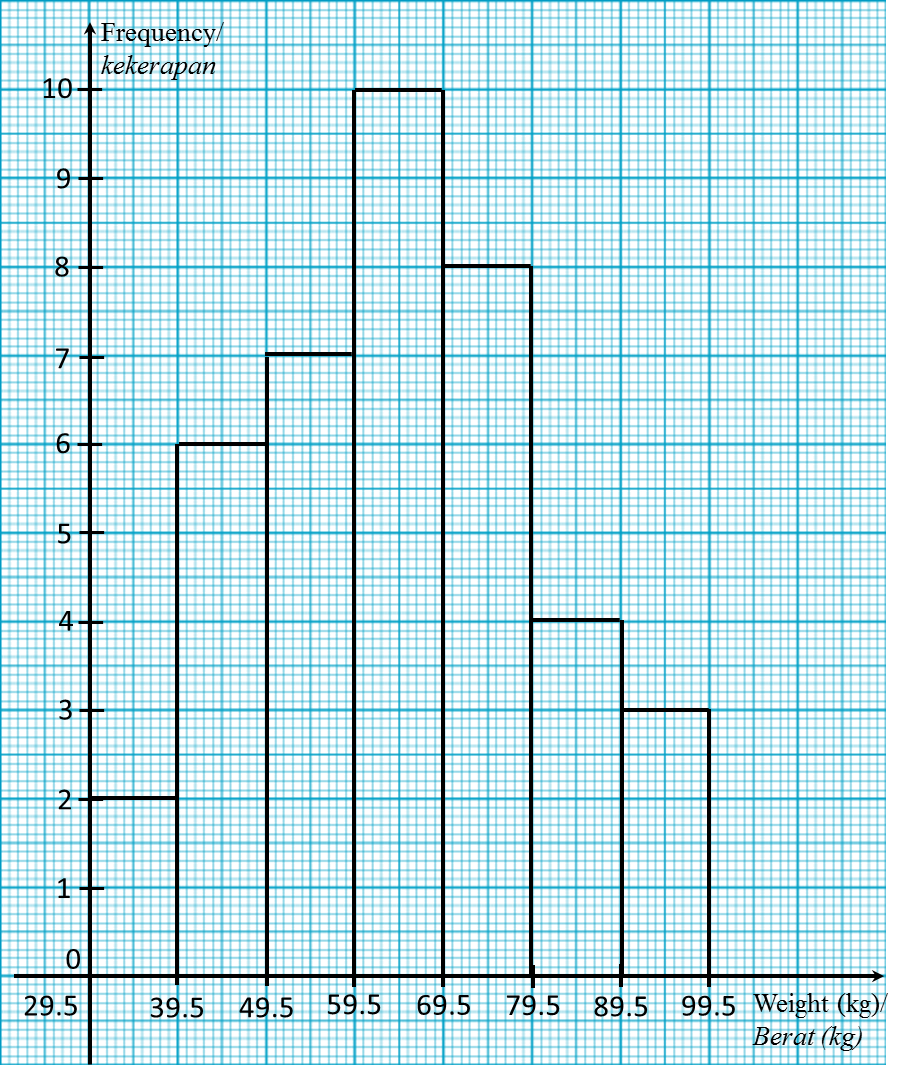
(d)
Modal class is 60 – 69.