Question 33:
Diagram 15 shows an undirected and weighted graph that connects five places in a town.
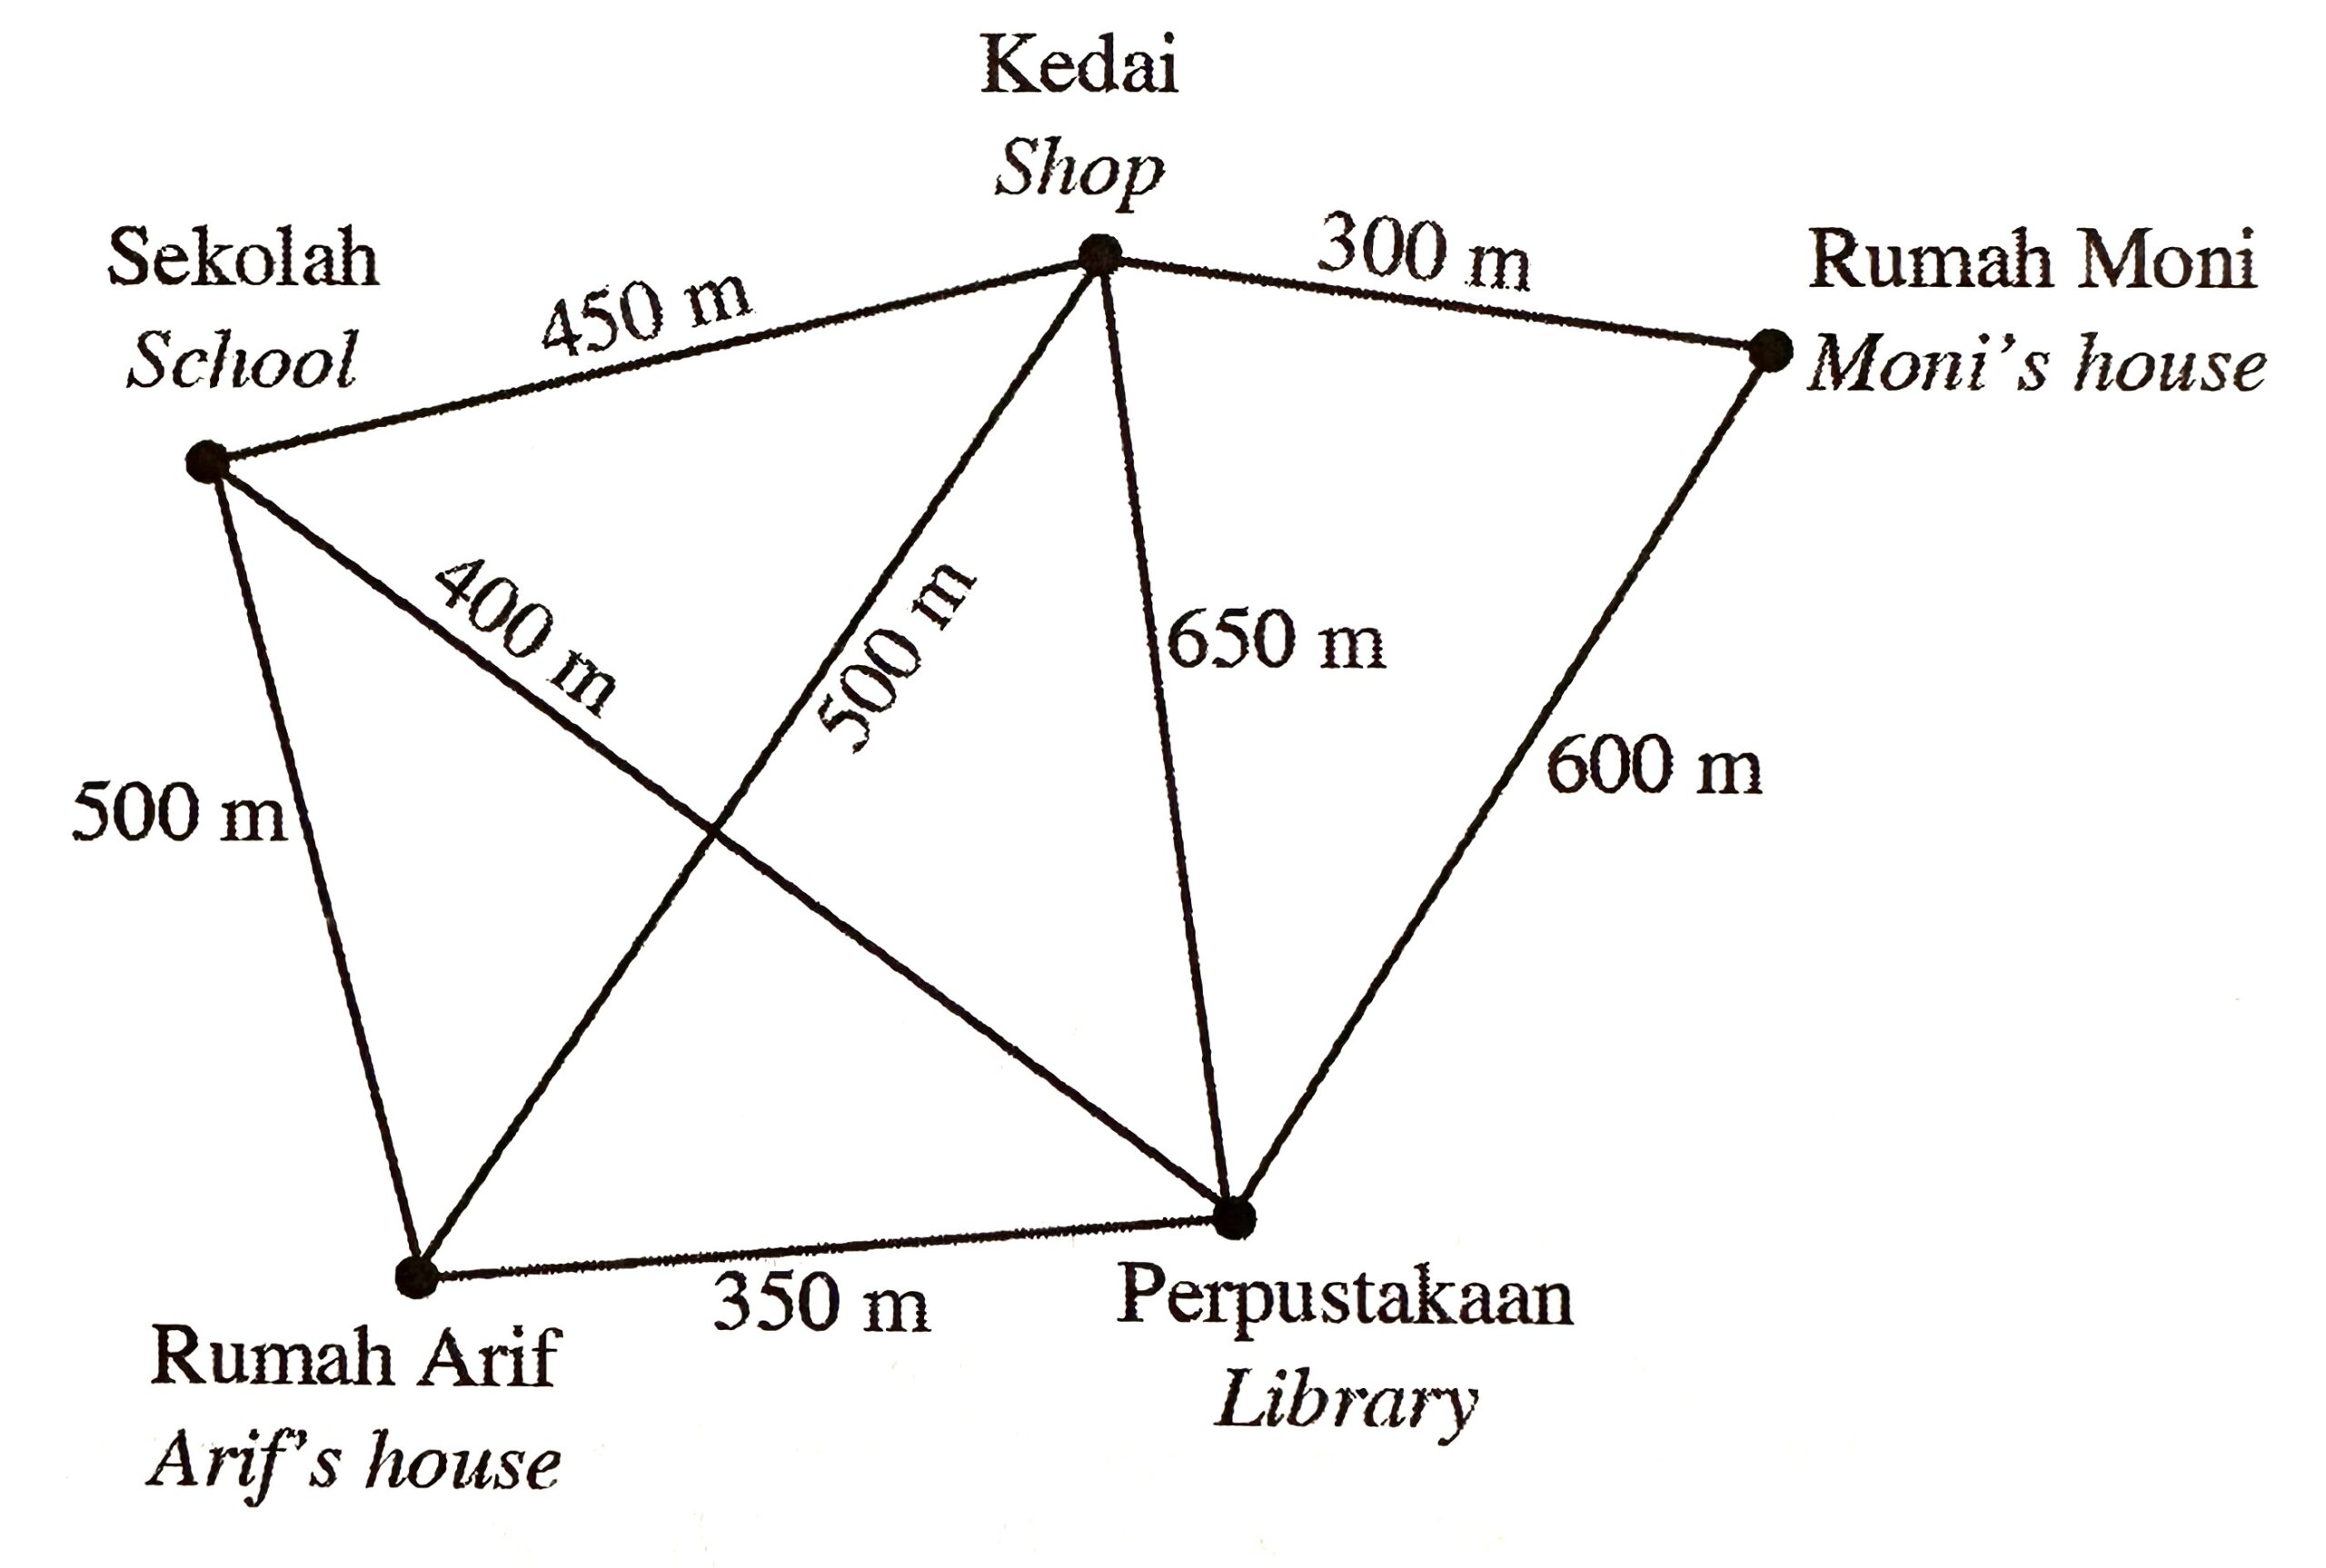
Calculate the difference in the shortest distances, in m, from Arif’s house and Moni’s house to the school.
A 950
B 850
C 500
D 250
Solution:
Answer : D
Shortest distance from Arif’s house to school
= 500 m
Shortest distance from Moni’s house to school
= 300 m + 450 m
=750 m
Difference in the shortest distance
= 750 m – 500 m
= 250 m
Diagram 15 shows an undirected and weighted graph that connects five places in a town.
Calculate the difference in the shortest distances, in m, from Arif’s house and Moni’s house to the school.
A 950
B 850
C 500
D 250
Solution:
Answer : D
Shortest distance from Arif’s house to school
= 500 m
Shortest distance from Moni’s house to school
= 300 m + 450 m
=750 m
Difference in the shortest distance
= 750 m – 500 m
= 250 m
Question 34:
Diagram 16 shows a set of data.
State the mode of the data.
A 3
B 4
C 8
D 9
Solution:
Answer : C

Mode = 8
Diagram 16 shows a set of data.
| 3 4 8 2 8 9 8 4 2 |
A 3
B 4
C 8
D 9
Solution:
Answer : C
Mode = 8
Question 35:
A bag contains 15 white balls, 10 blue balls and 12 green balls. A ball is chosen at random from the bag.
Find the probability of choosing a ball that is not green.
$$ \begin{aligned} &\text { A } \frac{1}{25}\\ &\text { B } \frac{12}{25}\\ &\text { C } \frac{15}{37}\\ &\text { D } \frac{25}{37} \end{aligned} $$
Solution:
Answer : D
$$ \begin{aligned} &\text { Probability of choosing a ball that is not green }\\ &\begin{aligned} & =\frac{15+10}{15+10+12} \\ & =\frac{25}{37} \end{aligned} \end{aligned} $$
A bag contains 15 white balls, 10 blue balls and 12 green balls. A ball is chosen at random from the bag.
Find the probability of choosing a ball that is not green.
$$ \begin{aligned} &\text { A } \frac{1}{25}\\ &\text { B } \frac{12}{25}\\ &\text { C } \frac{15}{37}\\ &\text { D } \frac{25}{37} \end{aligned} $$
Solution:
Answer : D
$$ \begin{aligned} &\text { Probability of choosing a ball that is not green }\\ &\begin{aligned} & =\frac{15+10}{15+10+12} \\ & =\frac{25}{37} \end{aligned} \end{aligned} $$
Question 36:
Diagram 17 is a line graph that shows the sales of rubber for five years.
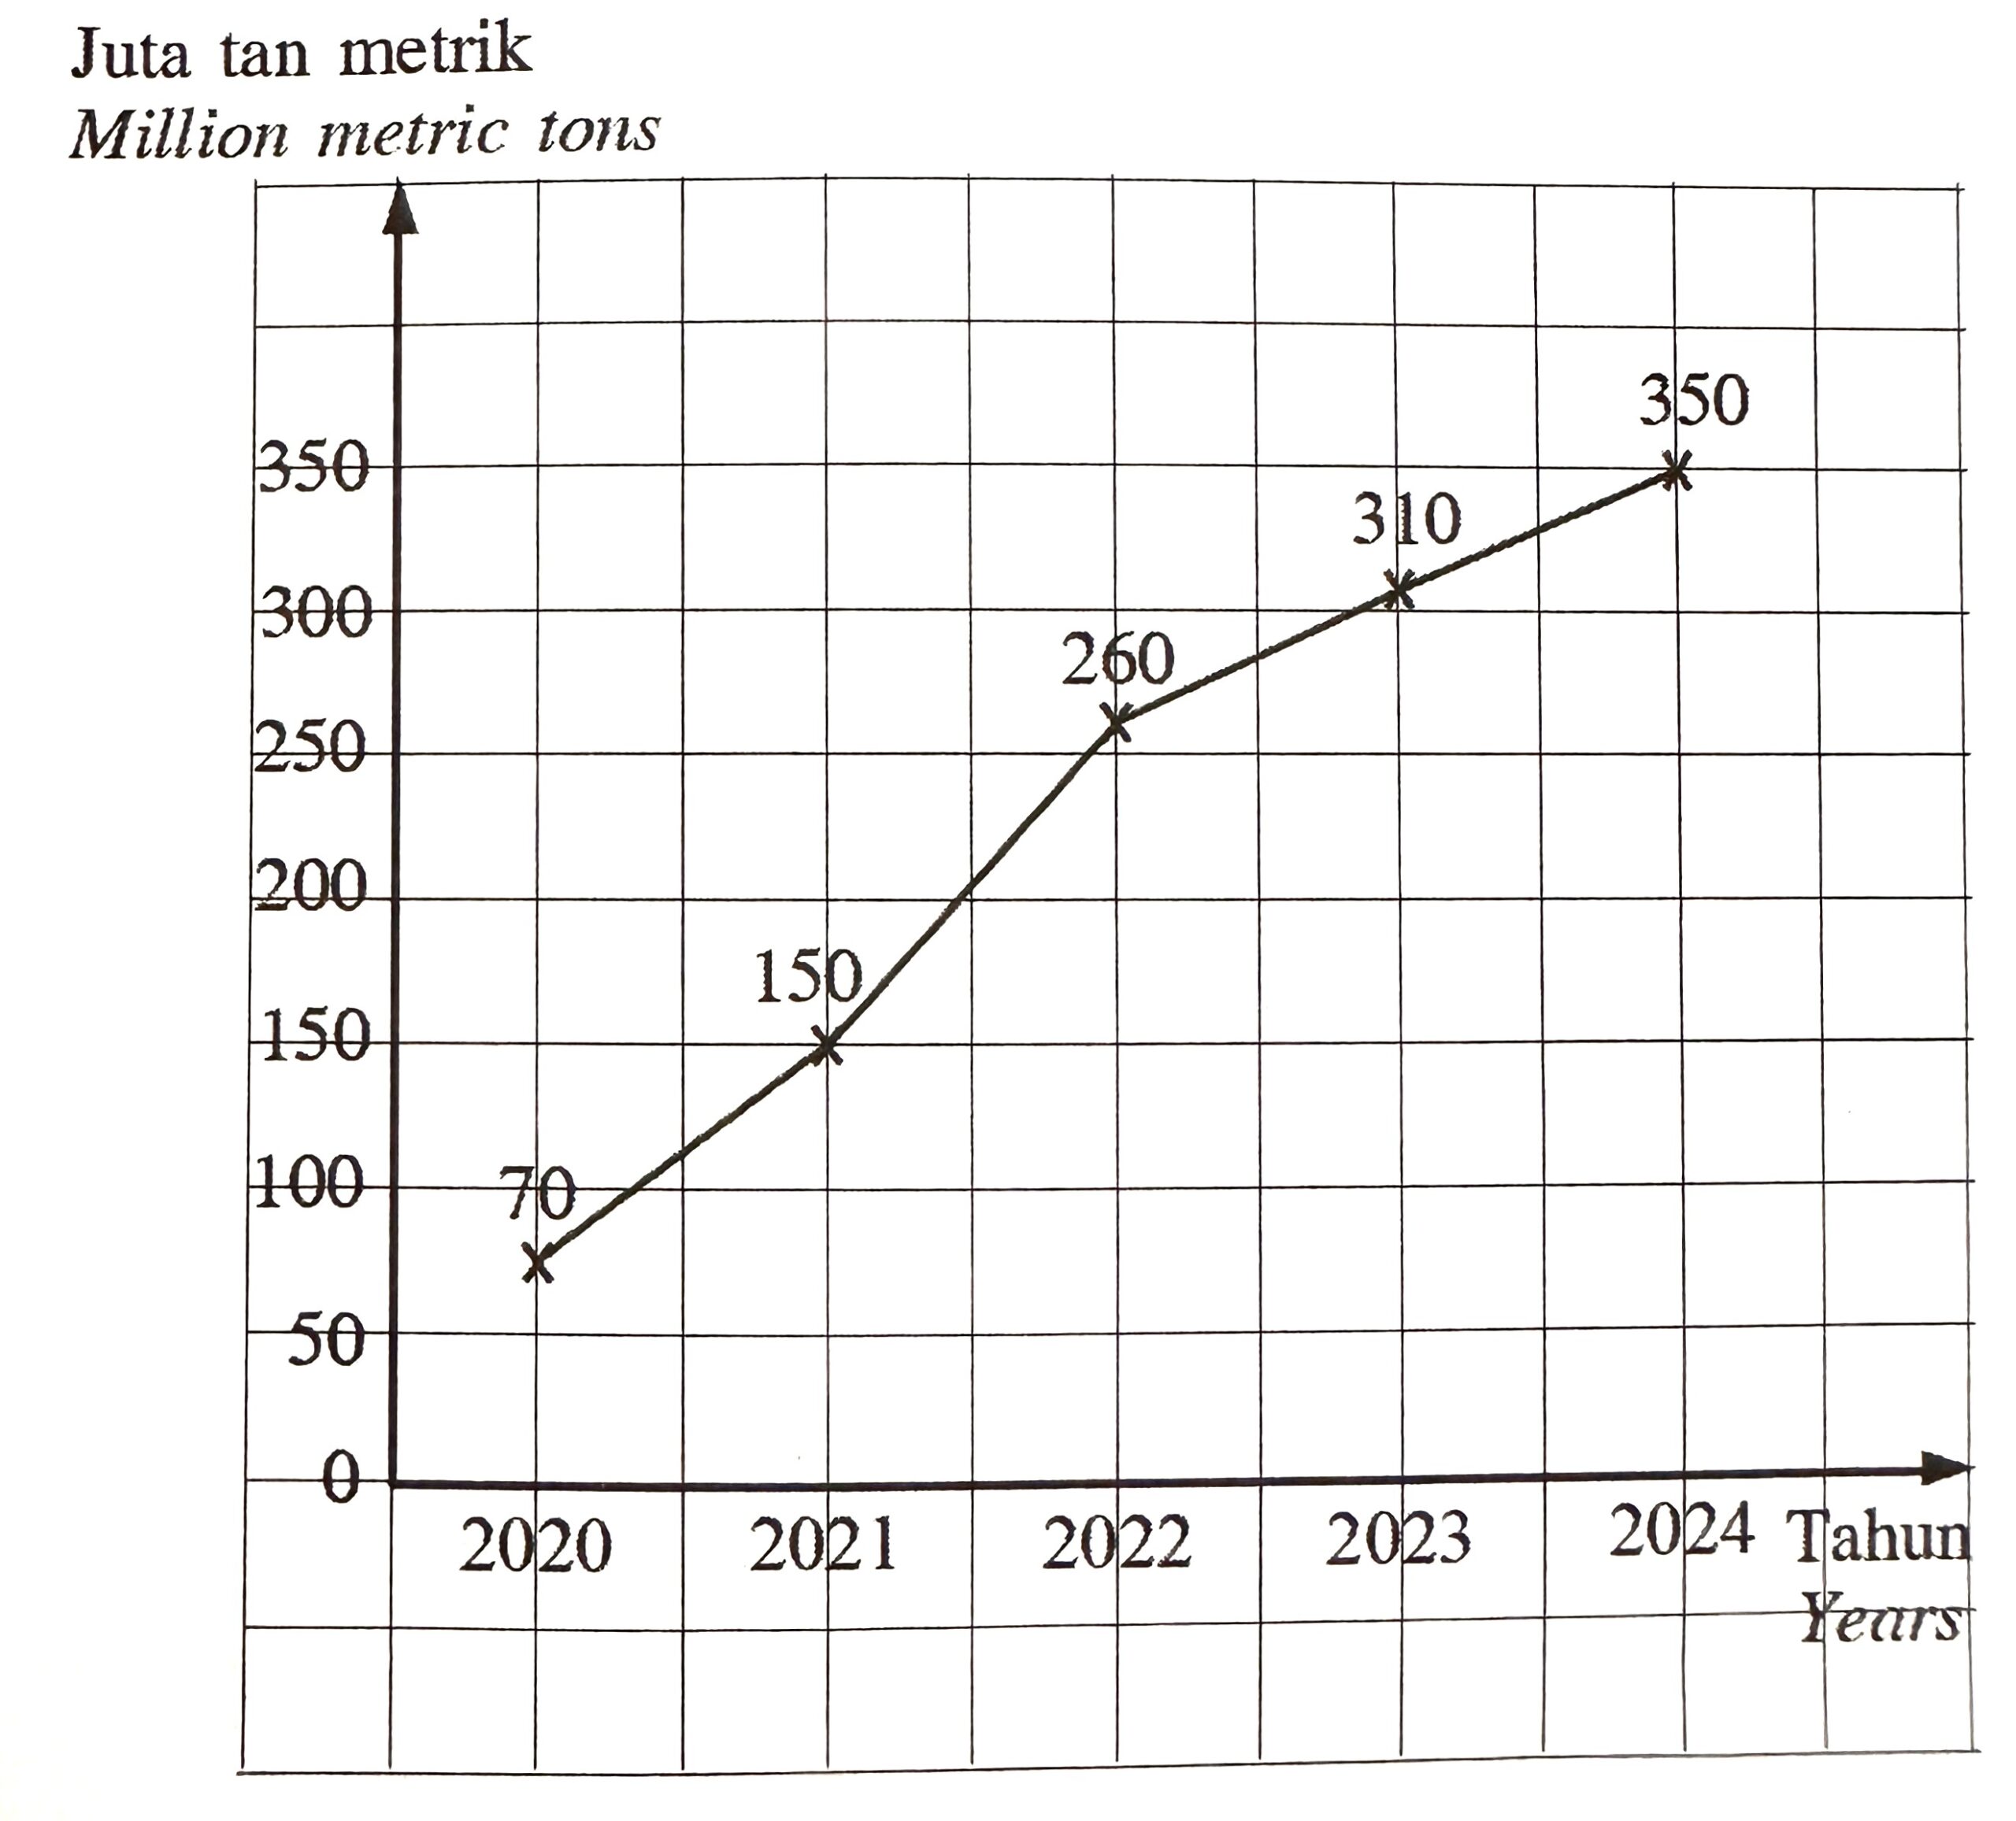
Find the average, in million metric tons, the increase in sales of the rubber from the year 2020 to 2023.
A 95
B 80
C 70
D 56
Solution:
Answer : B
$$ \begin{aligned} &\text { Average }\\ &\begin{aligned} & =\frac{310-70}{3} \\ & =80 \end{aligned} \end{aligned} $$
Diagram 17 is a line graph that shows the sales of rubber for five years.
Find the average, in million metric tons, the increase in sales of the rubber from the year 2020 to 2023.
A 95
B 80
C 70
D 56
Solution:
Answer : B
$$ \begin{aligned} &\text { Average }\\ &\begin{aligned} & =\frac{310-70}{3} \\ & =80 \end{aligned} \end{aligned} $$
Question 37:
Table 6 shows the information of marks obtained by 9 students in a mathematics quiz.
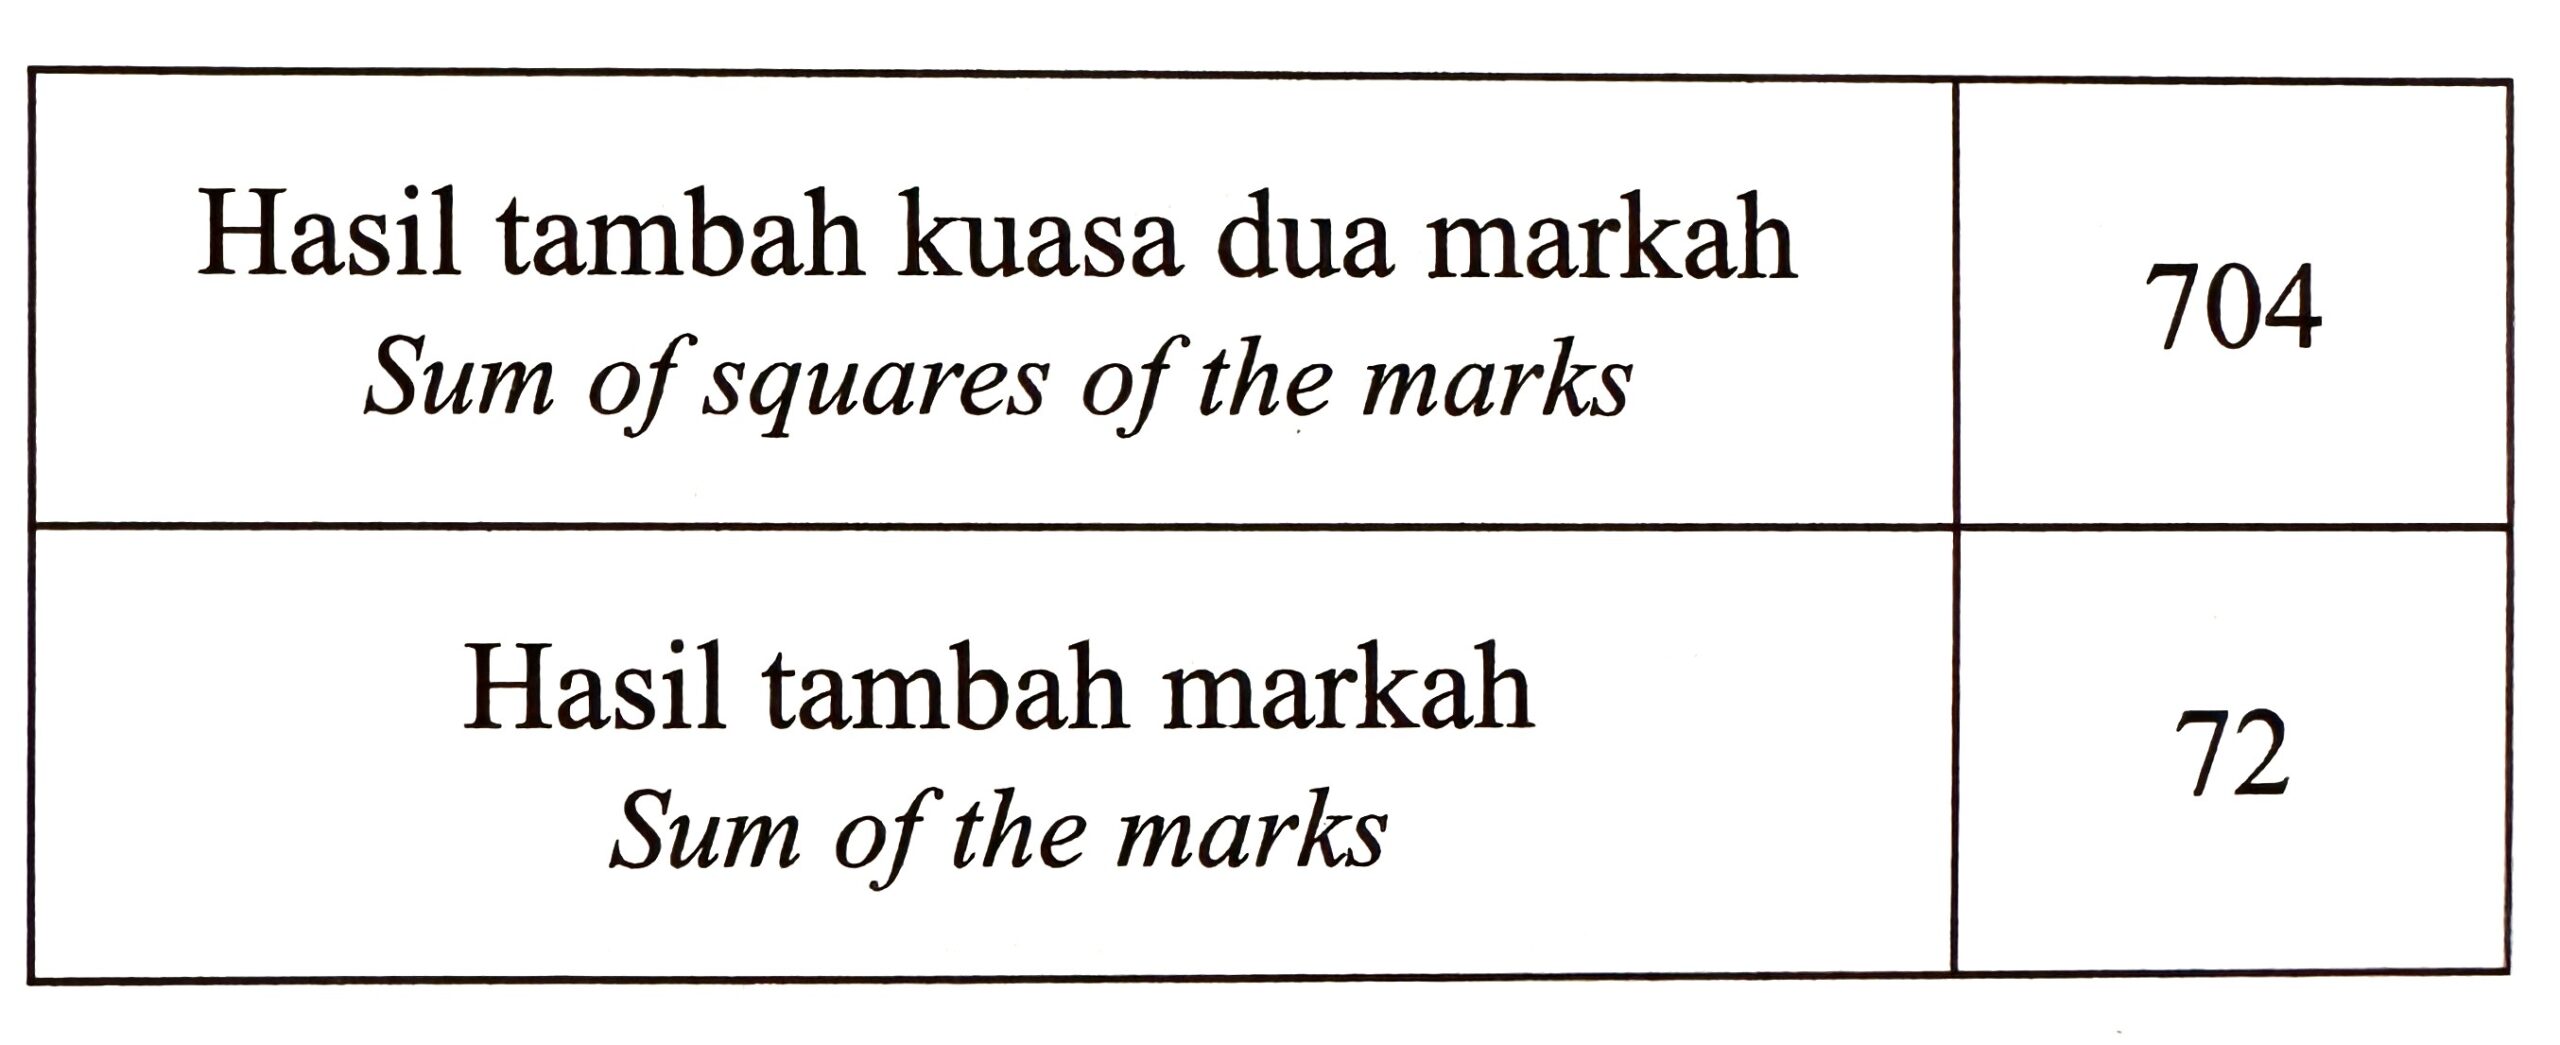 Calculate the variance of the marks.
A 70.22
B 62.22
C 38.72
D 14.22
Solution:
Answer : D
$$ \begin{aligned} \sigma^2 & =\frac{\sum x^2}{N}-\bar{x}^2 \\ & =\frac{704}{9}-\left(\frac{72}{9}\right)^2 \\ & =\frac{128}{9} \\ & =14.22 \end{aligned} $$
Table 6 shows the information of marks obtained by 9 students in a mathematics quiz.
Calculate the variance of the marks.A 70.22
B 62.22
C 38.72
D 14.22
Solution:
Answer : D
$$ \begin{aligned} \sigma^2 & =\frac{\sum x^2}{N}-\bar{x}^2 \\ & =\frac{704}{9}-\left(\frac{72}{9}\right)^2 \\ & =\frac{128}{9} \\ & =14.22 \end{aligned} $$
Question 38:
Diagram 18 is a tree diagram that shows an event of choosing 2 pens.
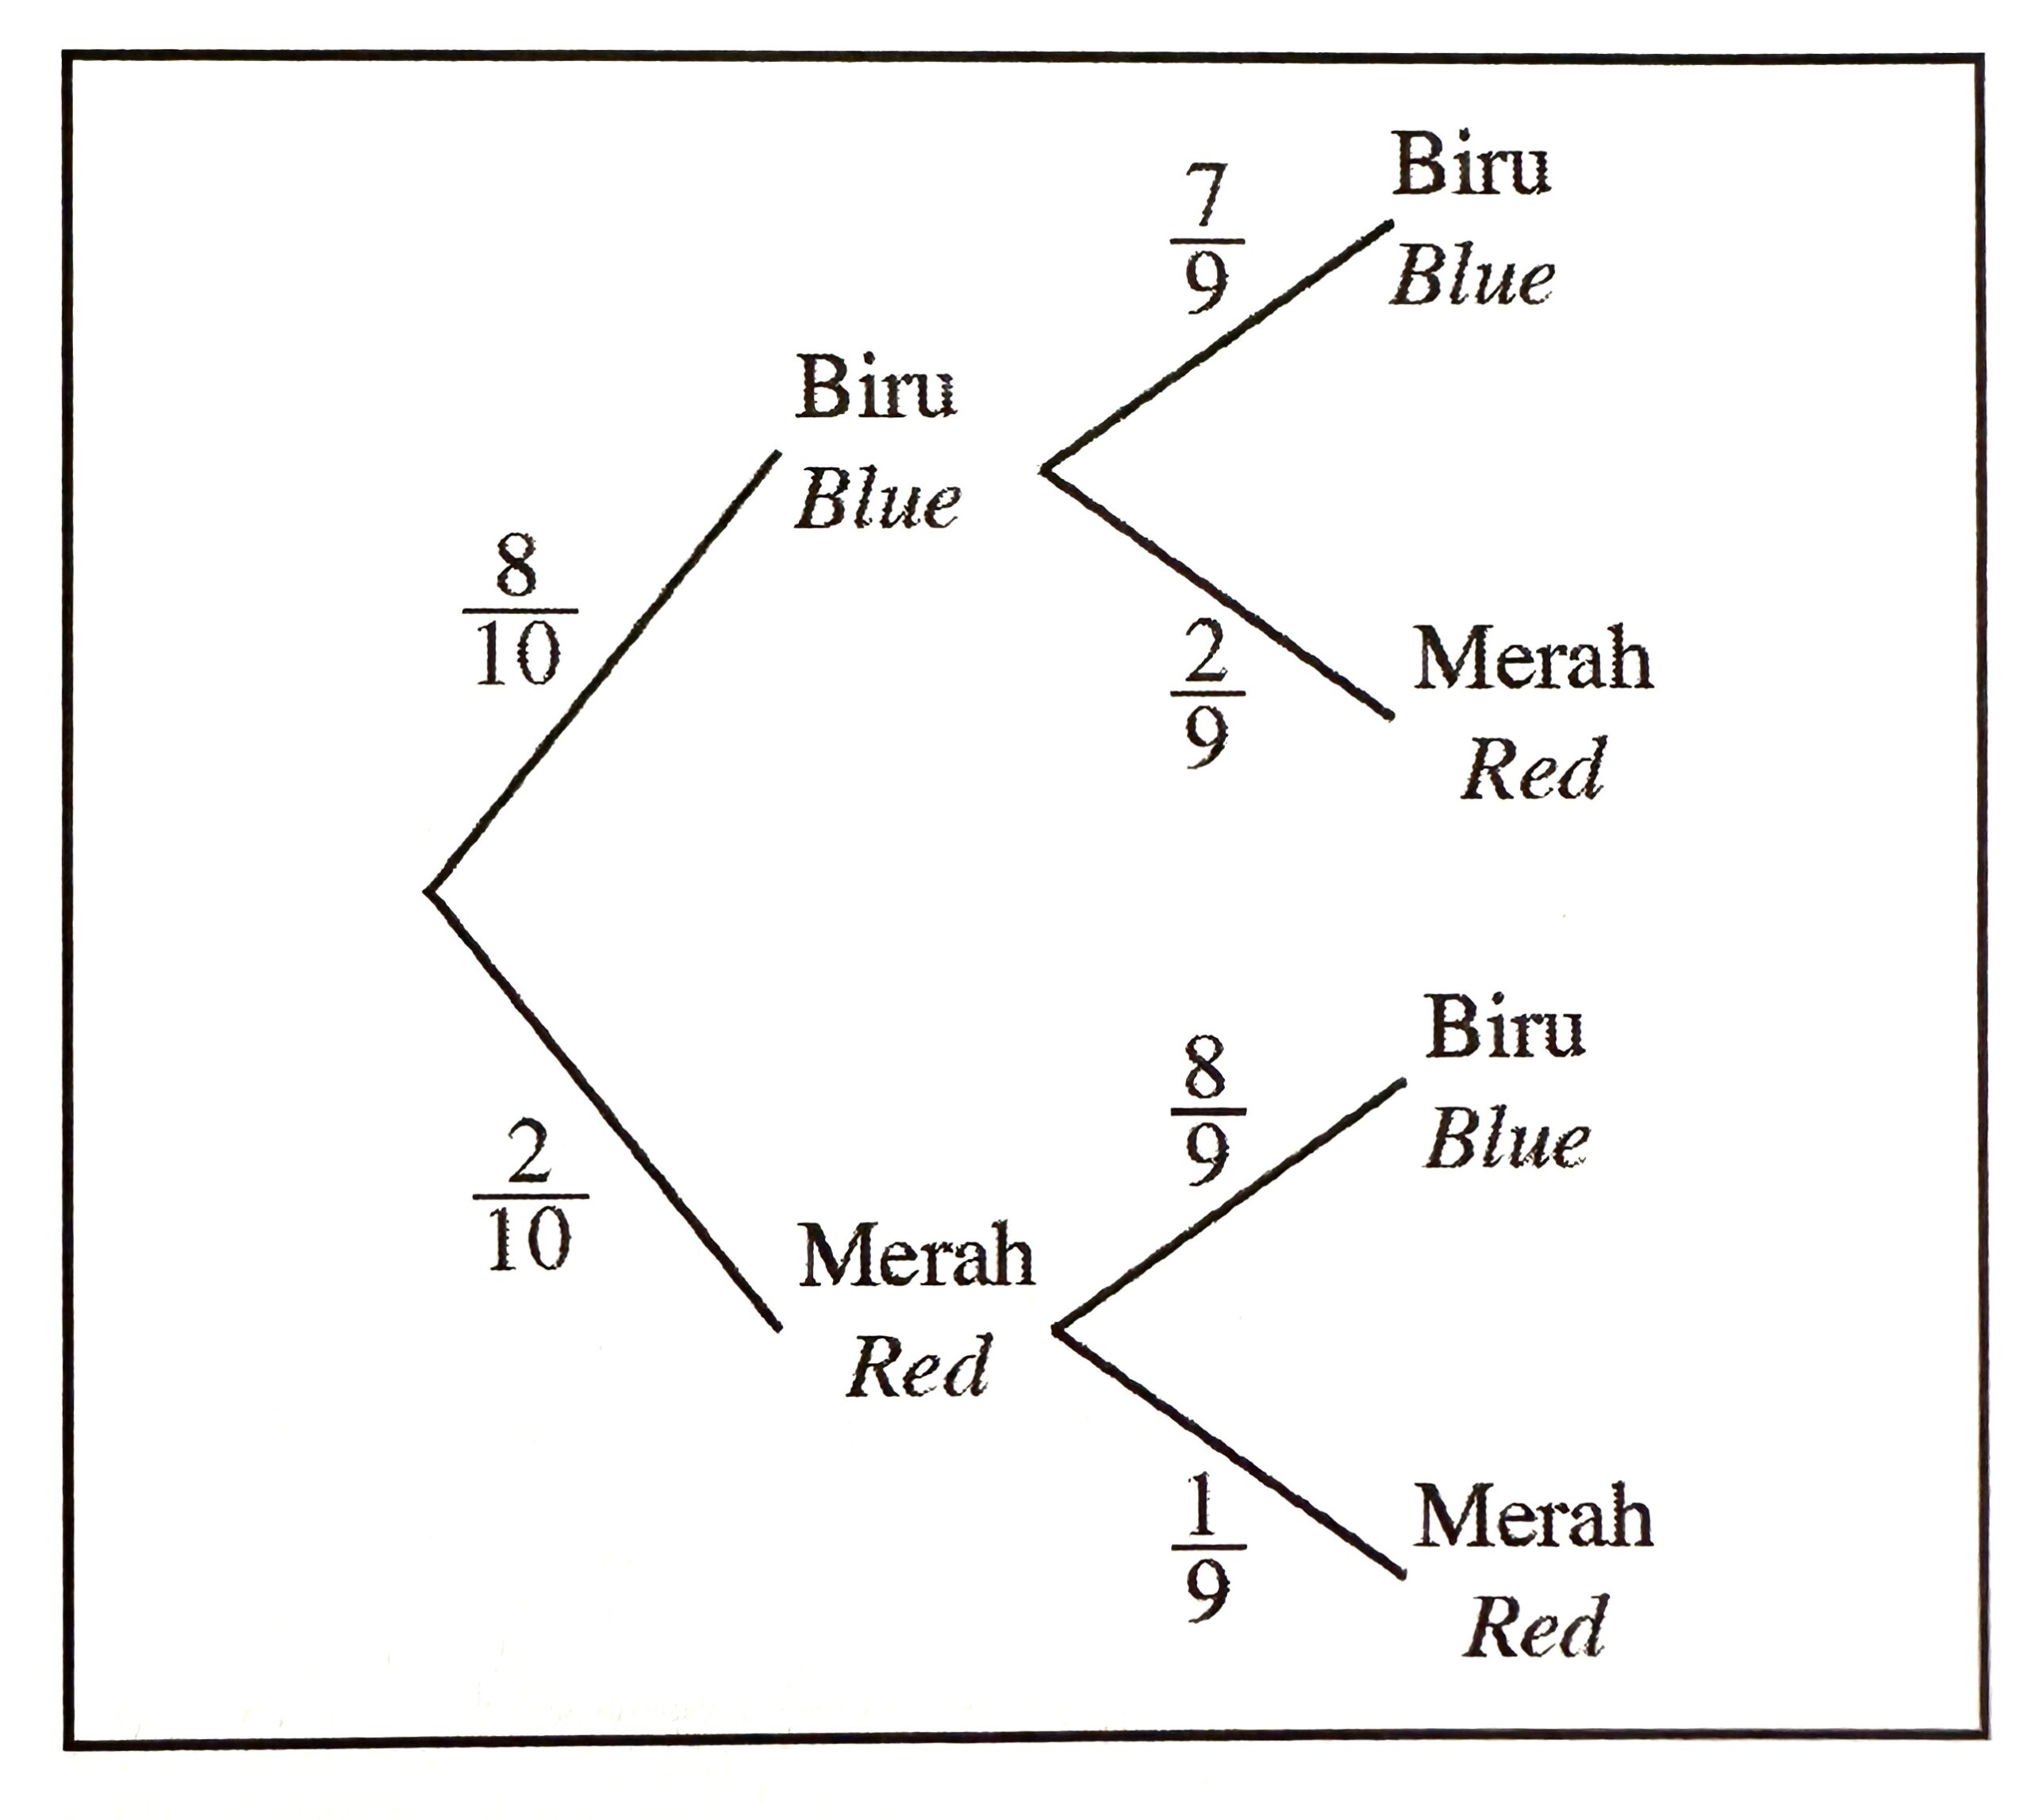
Calculate the probability that 2 red pens are chosen.
$$ \begin{aligned} &\text { A } \frac{1}{45}\\ &\text { B } \frac{2}{81}\\ &\text { C } \frac{14}{45}\\ &\text { D } \frac{1}{3} \end{aligned} $$
Solution:
Answer : A
$$ \begin{aligned} &\text { Probability that } 2 \text { red pens are chosen }\\ &\begin{aligned} & =\frac{2}{10} \times \frac{1}{9} \\ & =\frac{2}{90} \\ & =\frac{1}{45} \end{aligned} \end{aligned} $$
Diagram 18 is a tree diagram that shows an event of choosing 2 pens.
Calculate the probability that 2 red pens are chosen.
$$ \begin{aligned} &\text { A } \frac{1}{45}\\ &\text { B } \frac{2}{81}\\ &\text { C } \frac{14}{45}\\ &\text { D } \frac{1}{3} \end{aligned} $$
Solution:
Answer : A
$$ \begin{aligned} &\text { Probability that } 2 \text { red pens are chosen }\\ &\begin{aligned} & =\frac{2}{10} \times \frac{1}{9} \\ & =\frac{2}{90} \\ & =\frac{1}{45} \end{aligned} \end{aligned} $$
Question 39:
Diagram 19 is an incomplete Venn diagram that shows the relation between universal set, ξ, set L and set S.
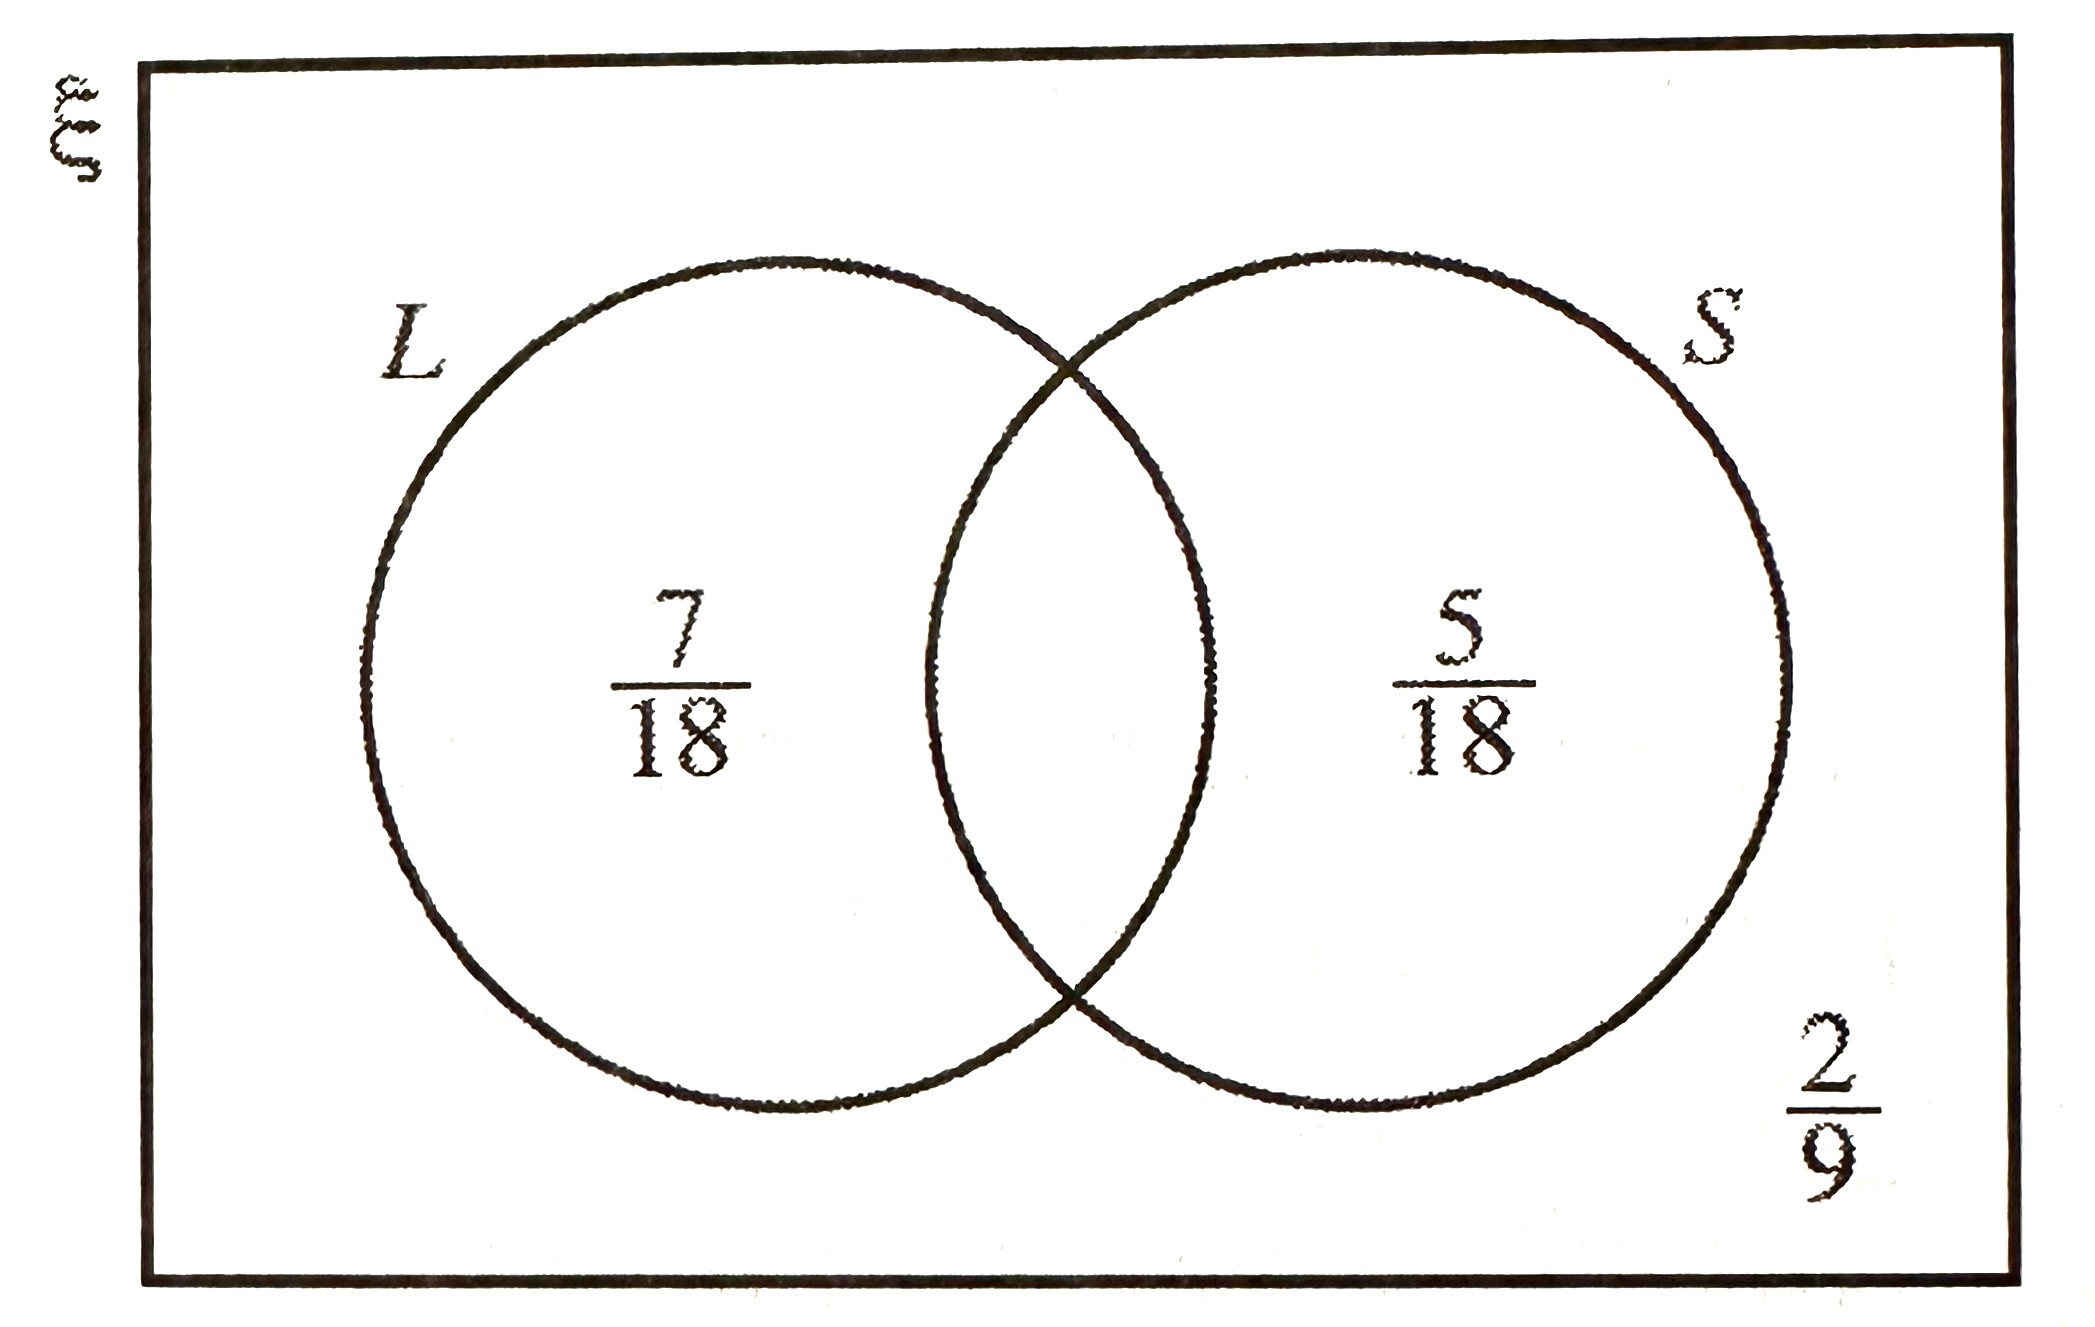
It is given that;
L is the event of Alex winning a medal in the long jump event,
S is the event of Alex winning a medal in the 100 m sprint event.
Calculate the probability that Alex wins the medals in both events.
$$ \begin{aligned} &\text { A } \frac{1}{9}\\ &\text { B } \frac{1}{3}\\ &\text { C } \frac{2}{3}\\ &\text { D } \frac{8}{9} \end{aligned} $$
Solution:
Answer : A
$$ \begin{aligned} &\text { Probability that Alex wins the medals in both events }\\ &\begin{aligned} & =1-\frac{7}{18}-\frac{5}{18}-\frac{2}{9} \\ & =\frac{18-7-5-4}{18} \\ & =\frac{2}{18} \\ & =\frac{1}{9} \end{aligned} \end{aligned} $$
Diagram 19 is an incomplete Venn diagram that shows the relation between universal set, ξ, set L and set S.
It is given that;
L is the event of Alex winning a medal in the long jump event,
S is the event of Alex winning a medal in the 100 m sprint event.
Calculate the probability that Alex wins the medals in both events.
$$ \begin{aligned} &\text { A } \frac{1}{9}\\ &\text { B } \frac{1}{3}\\ &\text { C } \frac{2}{3}\\ &\text { D } \frac{8}{9} \end{aligned} $$
Solution:
Answer : A
$$ \begin{aligned} &\text { Probability that Alex wins the medals in both events }\\ &\begin{aligned} & =1-\frac{7}{18}-\frac{5}{18}-\frac{2}{9} \\ & =\frac{18-7-5-4}{18} \\ & =\frac{2}{18} \\ & =\frac{1}{9} \end{aligned} \end{aligned} $$
Question 40:
Diagram 20 is an incomplete box plot showing the weight, in kg , of students of
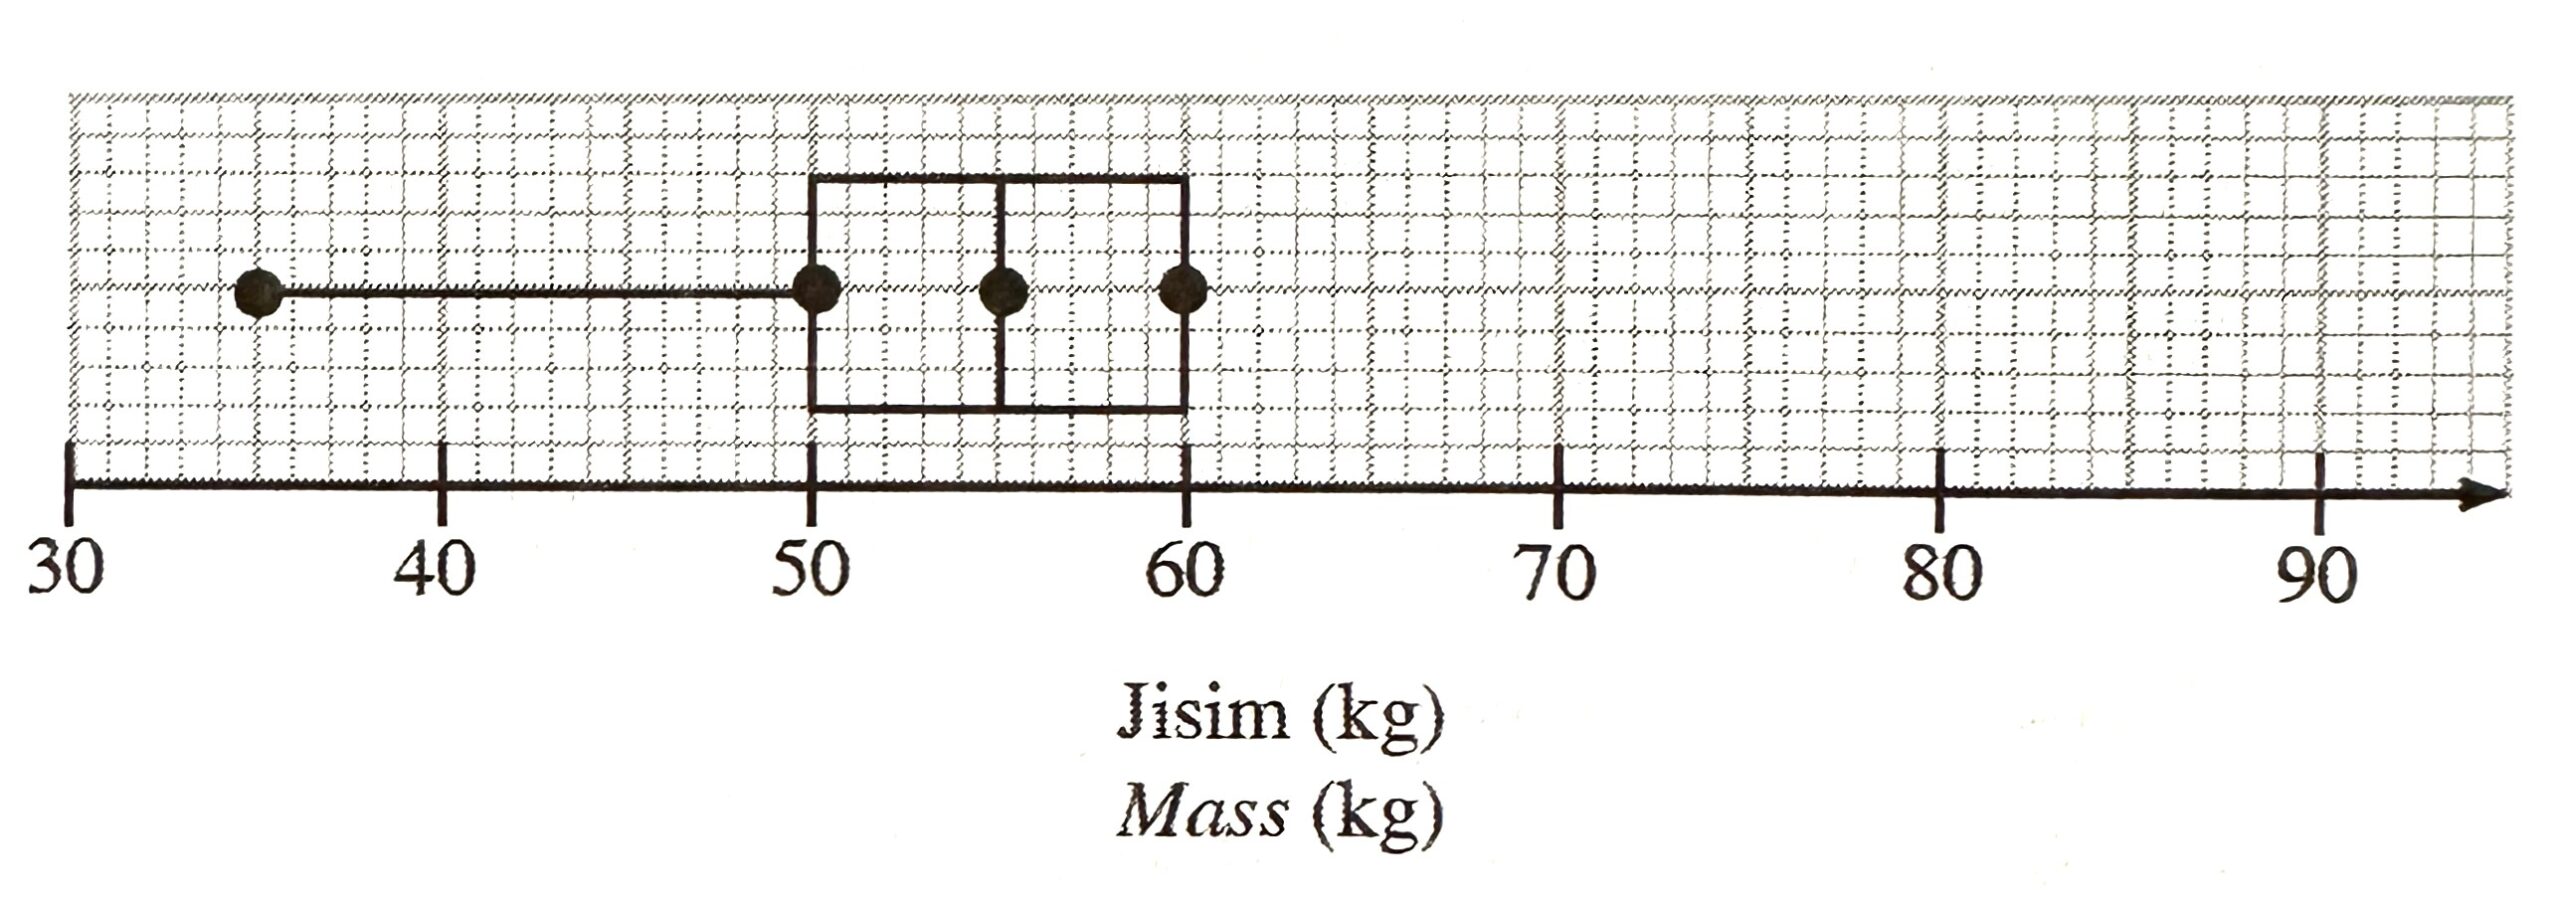
It is given that the range of the weight of the students is 50 kg.
Determine the shape of the distribution.
A Bell-shaped
B Uniform-shaped
C Left-skewed
D Right-skewed
Solution:
Answer : D
$$ \begin{aligned} \text { Range } & =x-35 \\ 50 & =x-35 \\ x & =35+50 \\ x & =85 \end{aligned} $$
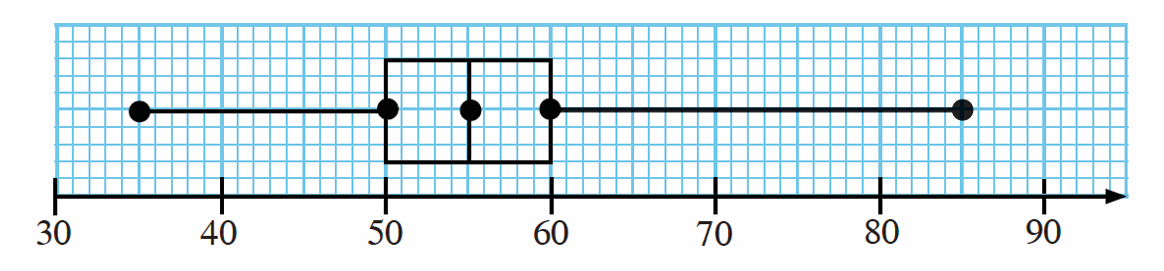 $$
\text { ∴ Right-skewed distribution. }
$$
Diagram 20 is an incomplete box plot showing the weight, in kg , of students of
It is given that the range of the weight of the students is 50 kg.
Determine the shape of the distribution.
A Bell-shaped
B Uniform-shaped
C Left-skewed
D Right-skewed
Solution:
Answer : D
$$ \begin{aligned} \text { Range } & =x-35 \\ 50 & =x-35 \\ x & =35+50 \\ x & =85 \end{aligned} $$
$$
\text { ∴ Right-skewed distribution. }
$$