Question 12:
(a) Table 8 shows the total expenditure, of customers at a supermarket on two different days.

Based on Table 8,
(i) State the size of class interval and the range of the data. [2 marks]
(ii) Find the value of x if the total number of customers on that day is 68. [2 marks]
(b) For this part of the question, use the graph paper provided on page 128.
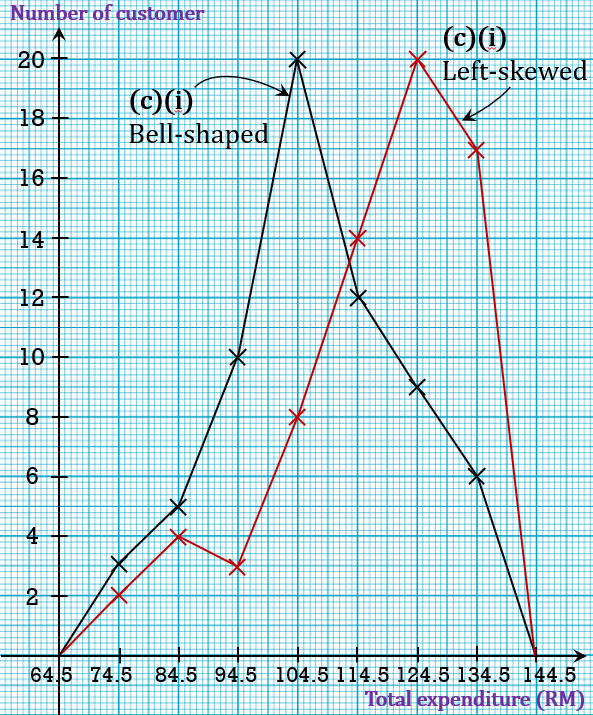
Diagram 6 on page 128 shows a frequency polygon drawn based on the data of the first day. Using the same graph paper, draw a frequency polygon based on the data of the second day.
[3 marks]
(c) From the graph in (b),
(i) state the distribution shape of the total amount of expenditures of both days, [2 marks]
(ii) determine which day represents the expenditure on the day the supermarket held a special sale.
Justify your answer. [1 mark]
Solution:
(a)(i)
Size of class interval = difference between the upper boundary and the lower boundary of a class interval
= 79.5 – 69.5
= 10.0
Range = midpoint of the highest class – midpoint of the lowest class
(a)(ii)
(b)

(c)

(a) Table 8 shows the total expenditure, of customers at a supermarket on two different days.

Based on Table 8,
(i) State the size of class interval and the range of the data. [2 marks]
(ii) Find the value of x if the total number of customers on that day is 68. [2 marks]
(b) For this part of the question, use the graph paper provided on page 128.
Diagram 6 on page 128 shows a frequency polygon drawn based on the data of the first day. Using the same graph paper, draw a frequency polygon based on the data of the second day.
[3 marks]
(c) From the graph in (b),
(i) state the distribution shape of the total amount of expenditures of both days, [2 marks]
(ii) determine which day represents the expenditure on the day the supermarket held a special sale.
Justify your answer. [1 mark]
Solution:
(a)(i)
Size of class interval = difference between the upper boundary and the lower boundary of a class interval
= 79.5 – 69.5
= 10.0
Range = midpoint of the highest class – midpoint of the lowest class
(a)(ii)
(b)

(c)

(c)(ii) Customer spent more money on the second day; thus, the special sale is on the second day.

