Question 13 (12 marks):
Diagram 13.1 shows three triangles RPQ, UST and RVQ, drawn on a Cartesian plane.
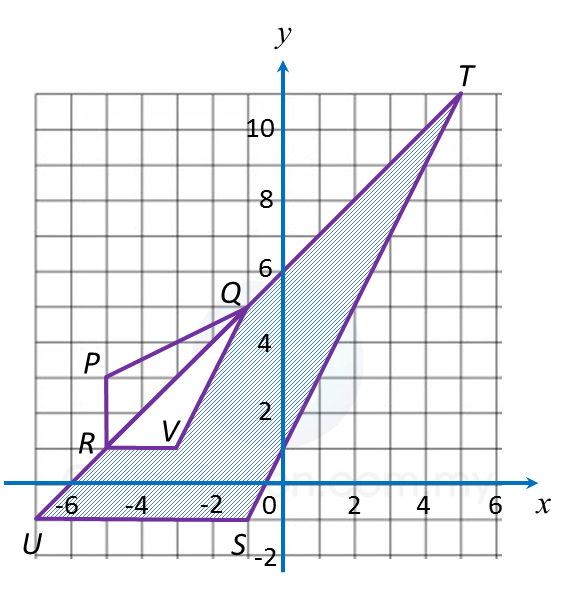 Diagram 13.1
(a) Transformation R is a rotation of 90o, clockwise about the centre O.
Transformation T is a translation .
State the coordinates of the image of point B under each of the following transformations:
(i) Translation T2,
(ii) Combined transformation TR.
(b)
(i) Triangle UST is the image of triangle RPQ under the combined transformation VW.
Describe in full the transformation:
(a) W (b) V
(ii) It is given that quadrilateral RPQ represents a region of area 15 m2.
Calculate the area, in m2, of the region represented by the shaded region.
Solution:
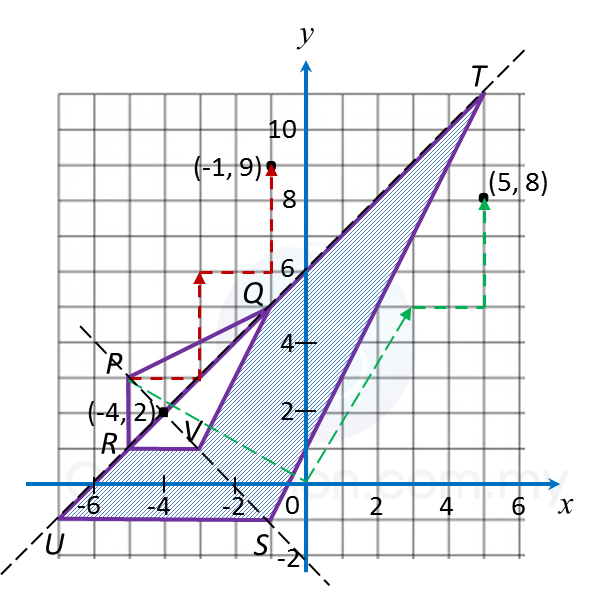
(a)
(i) (–5, 3) → T → (–3, 6) ) → T → (–1, 9)
(ii) (–5, 3) → R → (3, 5) → T → (5, 8)
(b)(i)(a)
W: A reflection in the line URQT.
(b)(i)(b)
(b)(ii)
Area of UST = (Scale factor)2 x Area of RPQ
= 32 x area of RPQ
= 32 x 15
= 135 m2
Therefore,
Area of the shaded region
= Area of UST – area of RPQ
= 135 – 15
= 120 m2
Diagram 13.1 shows three triangles RPQ, UST and RVQ, drawn on a Cartesian plane.
Diagram 13.1(a) Transformation R is a rotation of 90o, clockwise about the centre O.
Transformation T is a translation .
State the coordinates of the image of point B under each of the following transformations:
(i) Translation T2,
(ii) Combined transformation TR.
(b)
(i) Triangle UST is the image of triangle RPQ under the combined transformation VW.
Describe in full the transformation:
(a) W (b) V
(ii) It is given that quadrilateral RPQ represents a region of area 15 m2.
Calculate the area, in m2, of the region represented by the shaded region.
Solution:
(a)
(i) (–5, 3) → T → (–3, 6) ) → T → (–1, 9)
(ii) (–5, 3) → R → (3, 5) → T → (5, 8)
(b)(i)(a)
W: A reflection in the line URQT.
(b)(i)(b)
(b)(ii)
Area of UST = (Scale factor)2 x Area of RPQ
= 32 x area of RPQ
= 32 x 15
= 135 m2
Therefore,
Area of the shaded region
= Area of UST – area of RPQ
= 135 – 15
= 120 m2
Question 14 (12 marks):
Diagram 14 shows a histogram which represents the mass, in kg, for a group of 100 students.
 Diagram 14
(a) Based on Diagram 14, complete Table 14 in the answer space.
(b) Calculate the estimated mean mass of a student.
(c) For this part of the question, use graph paper. You may use a flexible curve ruler.
Using a scale of 2 cm to 10 kg on the horizontal axis and 2 cm to 10 students on the vertical axis, draw an ogive for the data.
(d) Based on the ogive drawn in 14(c), state the third quartile.
Answer:

Solution:
(a)

(b)

(c)

(d)
Third quartile
= 75th student
= 90.0 kg
Diagram 14 shows a histogram which represents the mass, in kg, for a group of 100 students.
Diagram 14(a) Based on Diagram 14, complete Table 14 in the answer space.
(b) Calculate the estimated mean mass of a student.
(c) For this part of the question, use graph paper. You may use a flexible curve ruler.
Using a scale of 2 cm to 10 kg on the horizontal axis and 2 cm to 10 students on the vertical axis, draw an ogive for the data.
(d) Based on the ogive drawn in 14(c), state the third quartile.
Answer:
Solution:
(a)
(b)
(c)
(d)
Third quartile
= 75th student
= 90.0 kg