Question 8:
Cikgu Lim accompanied his students to a chess competition in town G. After driving 96 km on the way back, they stopped for lunch. Diagram 4.1 shows a graph representing the journey.
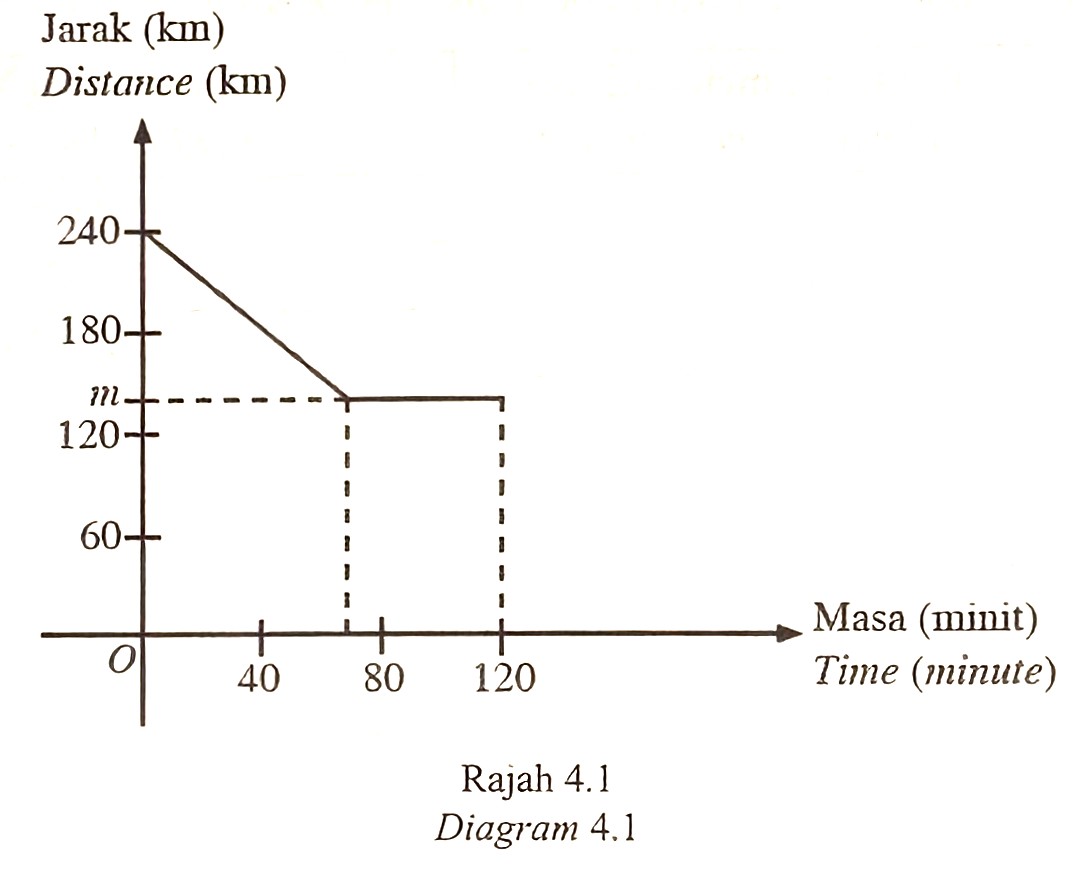
(a) Based on Diagram 4.1, find the value of m. [1 mark]
(b) At 1310 hour, they continue their journey back to school. Cikgu Lim drives at anaverage speed of 72 km h-1.
(i) Determine the time, in 24-hour system, they arrive school.
[3 marks]
(ii) Hence, in the answer space, complete Diagram 4.2 to represent their journey back to school. [1 mark]
Answer:
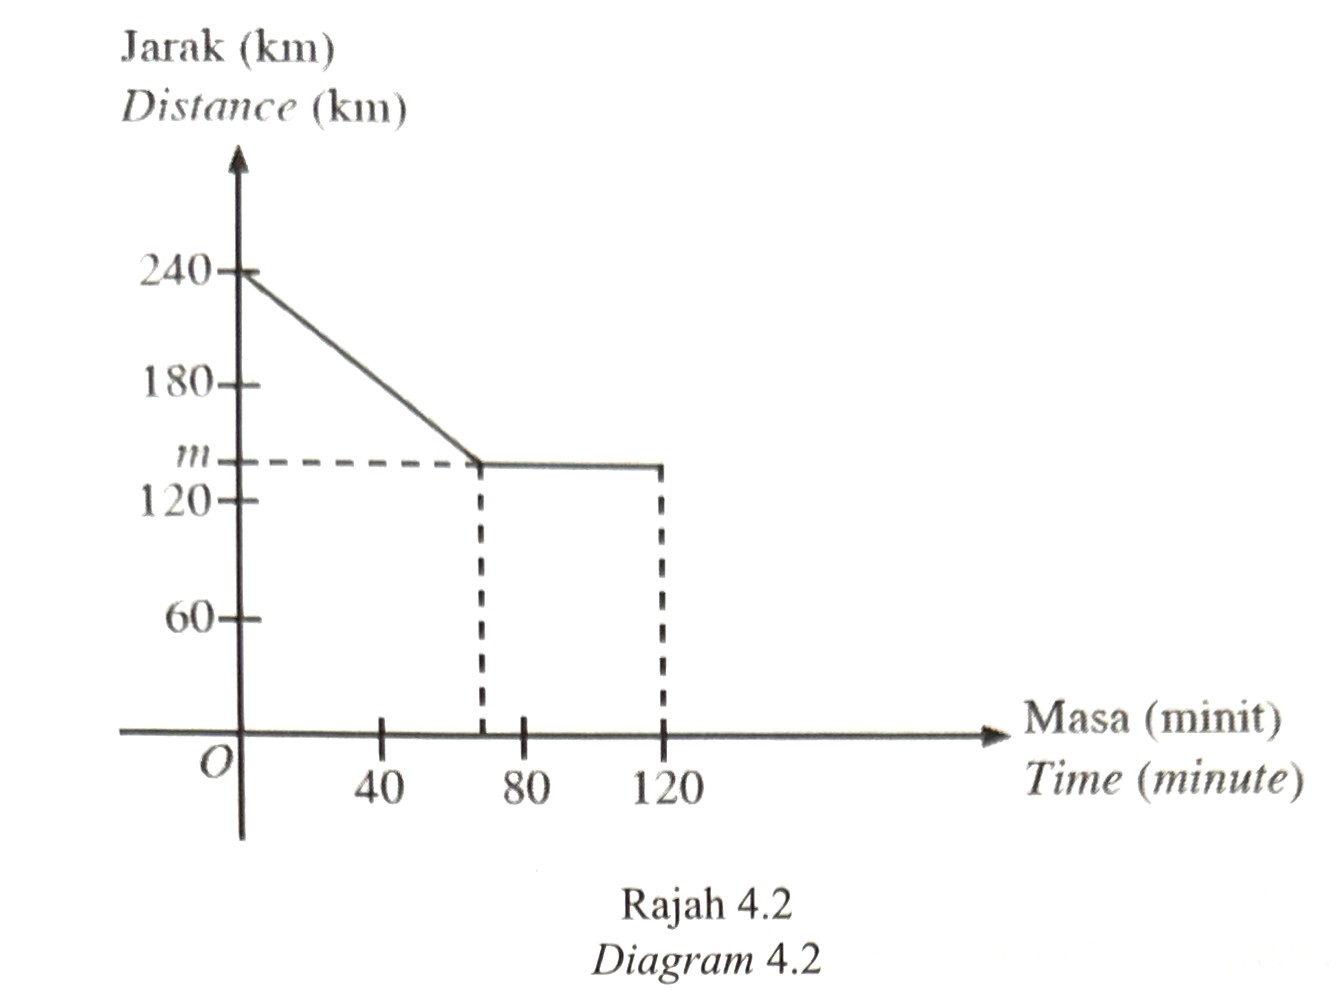
Answer:
(a) m = 240 – 96 = 144 km
(b)(i)
Duration of the return journey of Cikgu Lim and the students $$ \begin{aligned} & =\frac{144 \mathrm{~km}}{72 \mathrm{~km} \mathrm{h}^{-1}} \\ & =2 \mathrm{hours} \end{aligned} $$
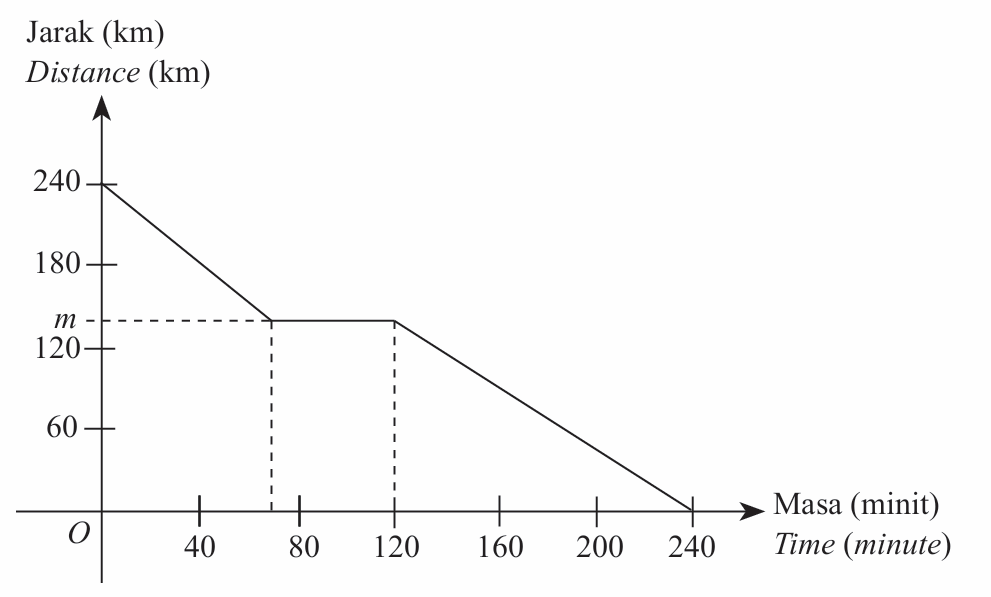
Time Cikgu Lim and the students arrive at school $$ \begin{aligned} & = 1310 \text { hour }+ 2 \text { hours } \\ & = 1310 \text { hour }+ 0200 \text { hour } \\ & = 1510 \text { hour } \end{aligned} $$
(b)(ii)
Cikgu Lim accompanied his students to a chess competition in town G. After driving 96 km on the way back, they stopped for lunch. Diagram 4.1 shows a graph representing the journey.
(a) Based on Diagram 4.1, find the value of m. [1 mark]
(b) At 1310 hour, they continue their journey back to school. Cikgu Lim drives at anaverage speed of 72 km h-1.
(i) Determine the time, in 24-hour system, they arrive school.
[3 marks]
(ii) Hence, in the answer space, complete Diagram 4.2 to represent their journey back to school. [1 mark]
Answer:
Answer:
(a) m = 240 – 96 = 144 km
(b)(i)
Duration of the return journey of Cikgu Lim and the students $$ \begin{aligned} & =\frac{144 \mathrm{~km}}{72 \mathrm{~km} \mathrm{h}^{-1}} \\ & =2 \mathrm{hours} \end{aligned} $$
Time Cikgu Lim and the students arrive at school $$ \begin{aligned} & = 1310 \text { hour }+ 2 \text { hours } \\ & = 1310 \text { hour }+ 0200 \text { hour } \\ & = 1510 \text { hour } \end{aligned} $$
(b)(ii)
Question 9:
Diagram 5 is a graph that shows a height of a sea tide recorded at the tide gauge station in an island.
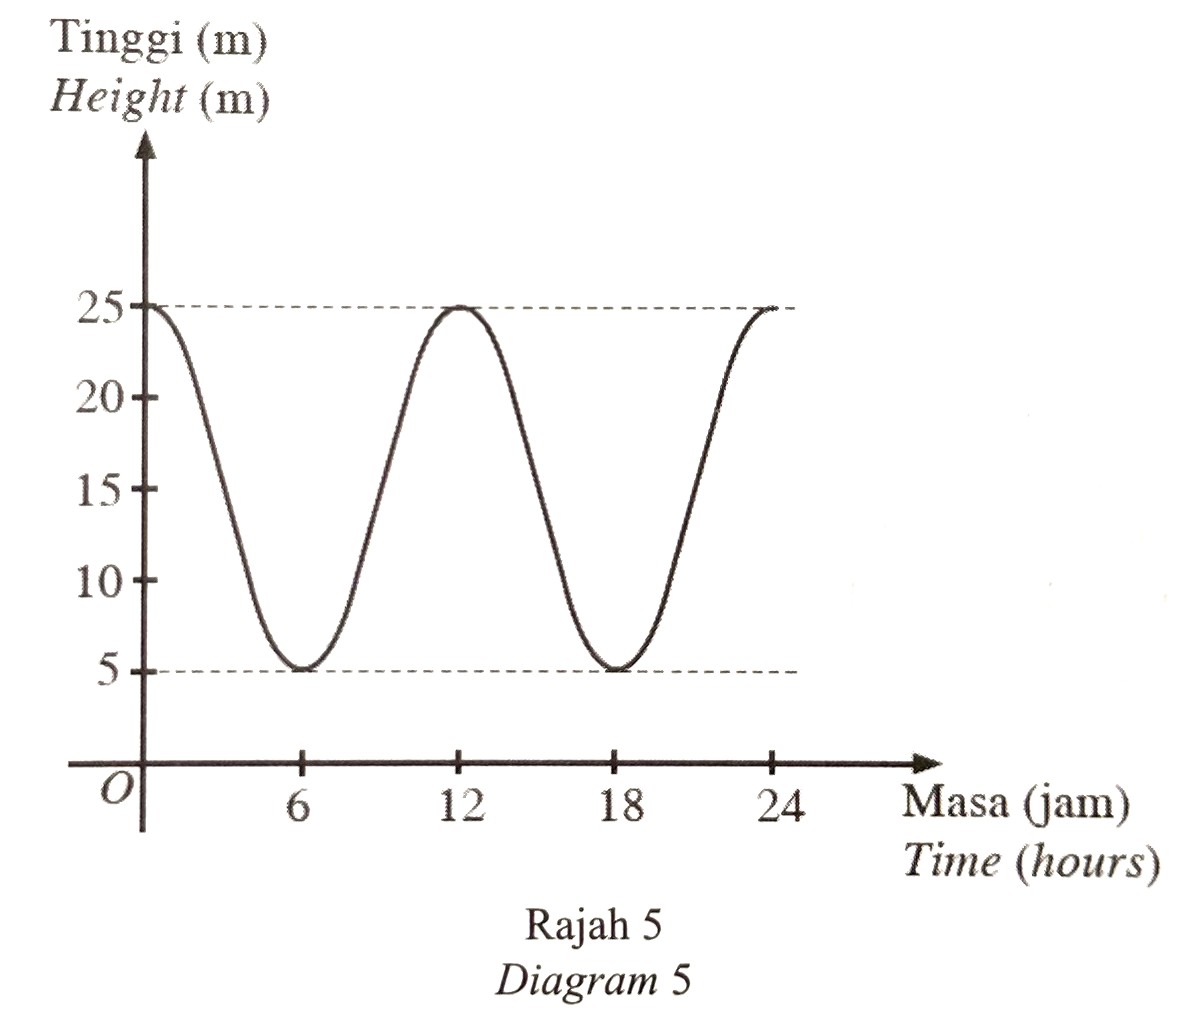 (a) State the amplitude, in m , of the graph. [1 mark]
(b) It is given that y is the height of the sea tide, in m , and x is the time, in hours.
(i) Write a function for the height of the sea tide in the form y = a cos bx + c. [2 marks]
(ii) Hence, determine the height of the sea tide, in m , when the time is at the 14th hours. [1 mark]
Answer:
(a)
Amplitude = 25 m – 15 m = 10 m
(b)(i)
$$ \begin{aligned} &\begin{aligned} a & =10 \\ b & =\frac{360^{\circ}}{12} \\ & =30 \\ c & =15 \end{aligned}\\ &y=10 \cos 30 x+15 \end{aligned} $$
(b)(ii)
$$ \begin{aligned} x=14, y & =10 \cos 30 x+15 \\ y & =[10 \cos 30(14)]+15 \\ y & =(10 \cos 420)+15 \\ y & =5+15 \\ y & =20 \end{aligned} $$
Diagram 5 is a graph that shows a height of a sea tide recorded at the tide gauge station in an island.
(a) State the amplitude, in m , of the graph. [1 mark](b) It is given that y is the height of the sea tide, in m , and x is the time, in hours.
(i) Write a function for the height of the sea tide in the form y = a cos bx + c. [2 marks]
(ii) Hence, determine the height of the sea tide, in m , when the time is at the 14th hours. [1 mark]
Answer:
(a)
Amplitude = 25 m – 15 m = 10 m
(b)(i)
$$ \begin{aligned} &\begin{aligned} a & =10 \\ b & =\frac{360^{\circ}}{12} \\ & =30 \\ c & =15 \end{aligned}\\ &y=10 \cos 30 x+15 \end{aligned} $$
(b)(ii)
$$ \begin{aligned} x=14, y & =10 \cos 30 x+15 \\ y & =[10 \cos 30(14)]+15 \\ y & =(10 \cos 420)+15 \\ y & =5+15 \\ y & =20 \end{aligned} $$
Question 10:
Diagram 6 shows two boxes. Box A contains three numbered cards and Box B contains four numbered cards.
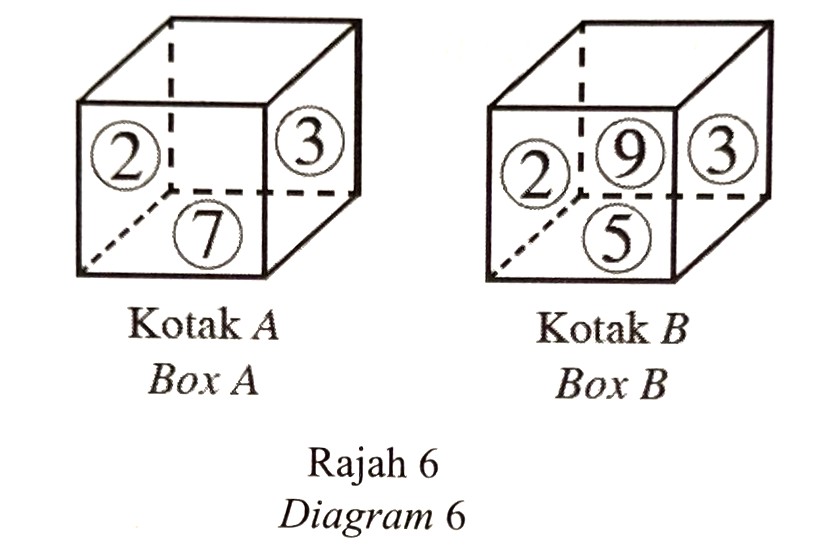
One card is drawn at random from each box. Find the probability that
(a) both cards show the same number, [2 marks]
(b) both cards show an odd number. [2 marks]
Answer:
(a)
$$ \begin{aligned} & P\left(2_A \times 2_B\right)+P\left(3_A \times 3_B\right) \\ & =\left(\frac{1}{3} \times \frac{1}{4}\right)+\left(\frac{1}{3} \times \frac{1}{4}\right) \\ & =\frac{1}{12}+\frac{1}{12} \\ & =\frac{2}{12} \text { or equivalent } \end{aligned} $$
(b)
$$ \begin{aligned} &P \text { (both cards show an odd number) }\\ &\begin{aligned} & =\frac{2}{3} \times \frac{3}{4} \\ & =\frac{6}{12} \text { or equivalent } \end{aligned} \end{aligned} $$
Diagram 6 shows two boxes. Box A contains three numbered cards and Box B contains four numbered cards.
One card is drawn at random from each box. Find the probability that
(a) both cards show the same number, [2 marks]
(b) both cards show an odd number. [2 marks]
Answer:
(a)
$$ \begin{aligned} & P\left(2_A \times 2_B\right)+P\left(3_A \times 3_B\right) \\ & =\left(\frac{1}{3} \times \frac{1}{4}\right)+\left(\frac{1}{3} \times \frac{1}{4}\right) \\ & =\frac{1}{12}+\frac{1}{12} \\ & =\frac{2}{12} \text { or equivalent } \end{aligned} $$
(b)
$$ \begin{aligned} &P \text { (both cards show an odd number) }\\ &\begin{aligned} & =\frac{2}{3} \times \frac{3}{4} \\ & =\frac{6}{12} \text { or equivalent } \end{aligned} \end{aligned} $$