Question 9:
Diagram below shows the speed-time graph for the movement of an object for a period of 34 seconds.
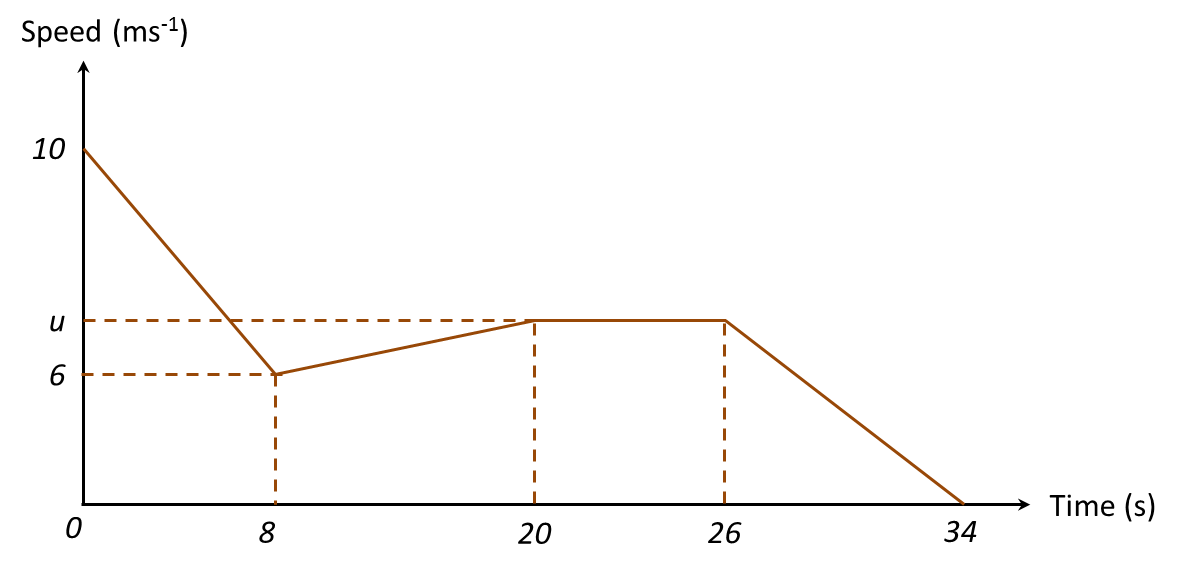
(a) State the duration of time, in seconds, for which the object moves with uniform speed.
(b) Calculate the rate of change of speed, in ms-2, of the object for the first 8 seconds.
(c) Calculate the value of u, if the average of speed of the object for the last 26 seconds is 6 ms-1.
Solution:
(a) Duration of time = 26s – 20s = 6s
Diagram below shows the speed-time graph for the movement of an object for a period of 34 seconds.
(a) State the duration of time, in seconds, for which the object moves with uniform speed.
(b) Calculate the rate of change of speed, in ms-2, of the object for the first 8 seconds.
(c) Calculate the value of u, if the average of speed of the object for the last 26 seconds is 6 ms-1.
Solution:
(a) Duration of time = 26s – 20s = 6s
Question 10:
Diagram shows the speed-time graph for the movement of two particles, J and K, for a period of t s. The graph ABCD represents the movement of J and the graph AE represents the movement of K. Both particles start at the same point and move along the same route.
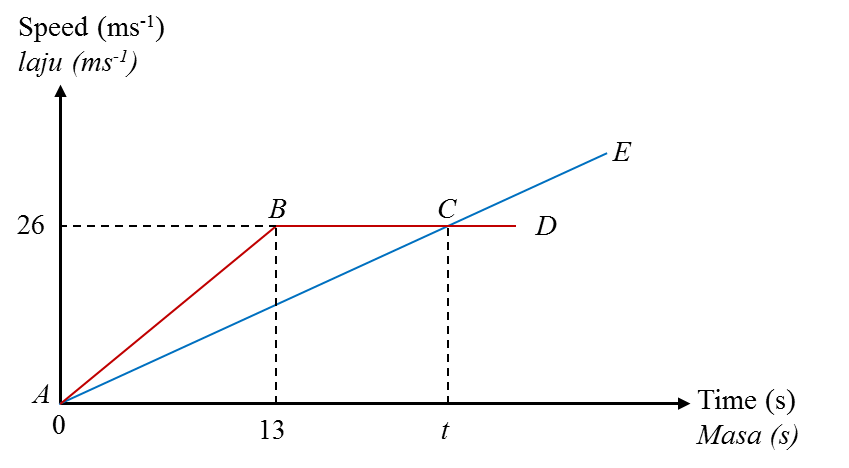
Diagram shows the speed-time graph for the movement of two particles, J and K, for a period of t s. The graph ABCD represents the movement of J and the graph AE represents the movement of K. Both particles start at the same point and move along the same route.
(a) State the uniform speed, in ms-1, of particle J.
(b) Calculate the rate of change of speed, in ms-2, of particle J for the first 13 s.
(c) At t s, the difference between the distance travelled by J and K is 169 m. Calculate the value of t.
[ 6 marks ]
Solution:
(a)
Uniform speed of particle J = 26 ms-1
(b)
Rate of change of speed of particle J for the first 13 s
(c)
Given at t s, the difference between the distance travelled by J and K is 169
(distance travelled by particle J) – (distance travelled by particle K) = 169
[ ½ (t – 13 + t) × 26 ] – [ ½ (26) (t )] = 169
[ 13 (2t – 13) ] – 13t = 169
( 26t – 169 – 13t ) = 169
13t = 338
t = 26