2.4 SPM Practice (Short Questions)
Question 1:
Which of the following graphs represent y = –x2 – x + 2?


Solution:
1. The coefficient of x2 < 0, its shape is ∩.
2. Find the x-intercepts by substituting y = 0 into the function.
y = –x2 –x + 2
when y = 0
0 = (–x + 1) (x + 2)
x = 1, –2
The answer is A.
Question 2:
Which of the following graphs represent 3y = 18 + 2x?
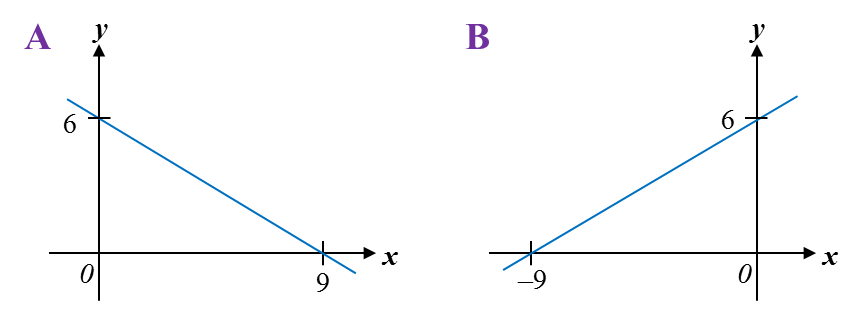
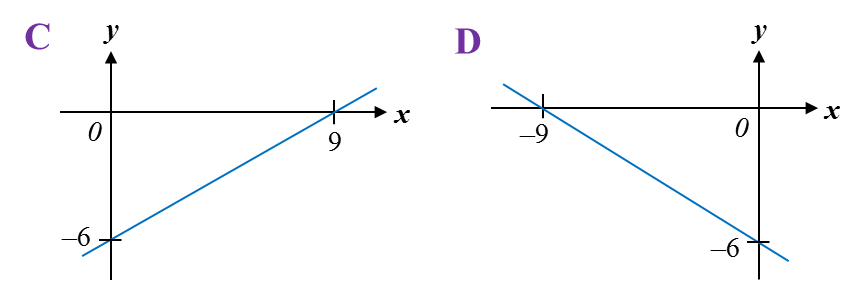
Solution:
1. The highest power of x = 1, it is a linear graph, i.e. a straight line.
2. The coefficient of x > 0, the straight line is /.
3y = 18 + 2x
On the y-axis, x = 0.
3y = 18
y = 6
On the x-axis, y = 0.
0 = 18 + 2x
2x = –18
x = –9
The answer is B.