7.2 Quantity Represented by the Area under a Graph (Part 1)
1. In the speed-time graph,
(a) Quantity represented by the gradient of the graph is acceleration or the rate of change of speed.
(b) Quantity represented by the area under the graph is distance.
Example 1:
Calculate the distance of each of the following graphs.
(a)
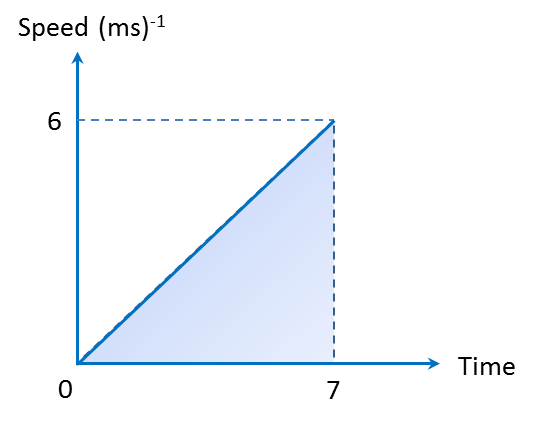
Distance = Area under the speed-time graph = Area of a triangle
(b)
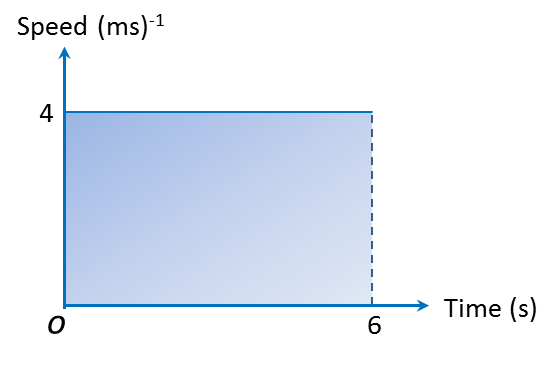
Distance = Area under the speed-time graph = Area of a rectangle
Distance = Length × Breadth
= 6 × 4 = 24 m
(c)
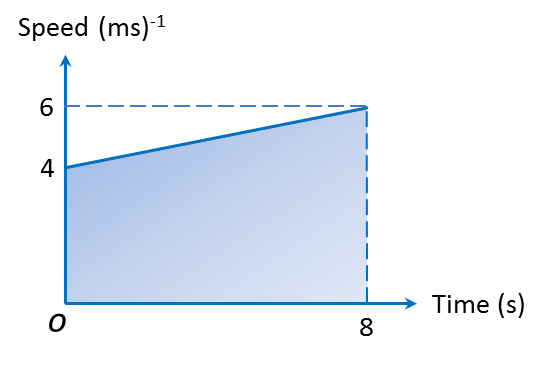
(c)
Distance = Area under the speed-time graph = Area of a trapezium
Combination of Graphs
Example 2:
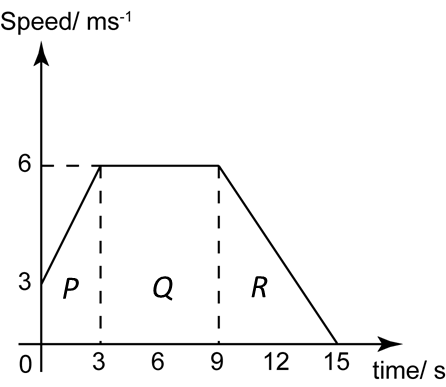
The diagram above shows the speed-time graph of a moving object for 15 seconds.
(a) State the length of time, in s, that the particle moves with constant speed.
(b) Calculate the rate of change of speed, in ms-2, in the first 3 seconds.
(c) Calculate the average speed of the object in 15 seconds.
Solution:
(a)
Length of time that the particle moves with constant speed
= 9 – 3 = 6 s
(b)
Rate of change of speed in the first 3 seconds
= acceleration = gradient
(c)
Total distance travelled of the object in 15 seconds
= Area under the graph in the 15 seconds
= Area P + Area Q + Area R
Average speed of the object in 15 seconds
Hi, for example 2 part c, Area of P is 1/2 x (3+6) x 6, the answer should be 27.5 isn’t it?
Dear Pb,
thanks for pointing out our mistake, correction had been made accordingly.