1.2 The Graph of Quadratic Function
- The graph of quadratic function is parabola.
- When the coefficient of x2 is positive the graph is a parabola with U shape.
- When the coefficient of x2 is negative the graph is a parabola with ∩ shape.

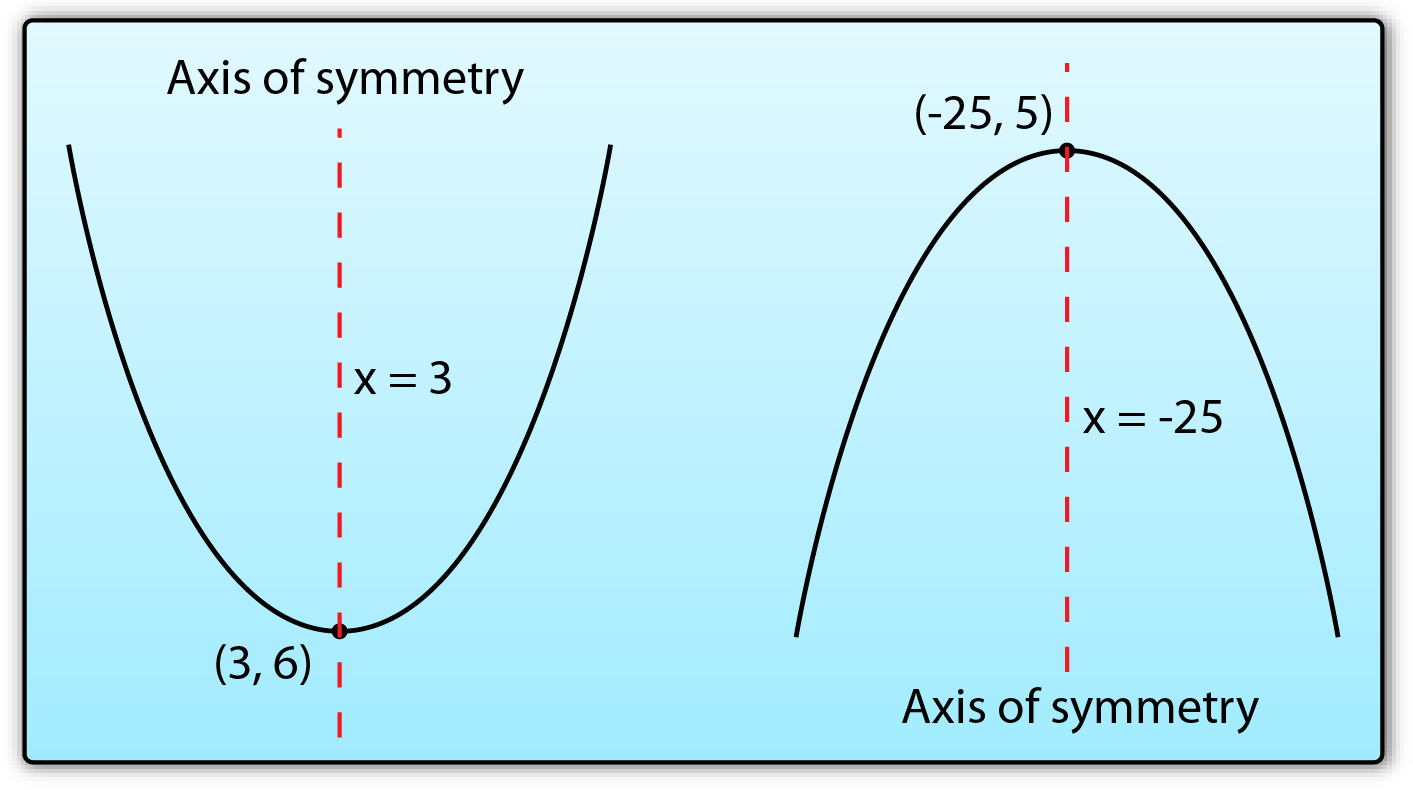
Axis of Symmetry
The axis of symmetry is a vertical line passing through the maximum or minimum point of the parabola.