Question 12:
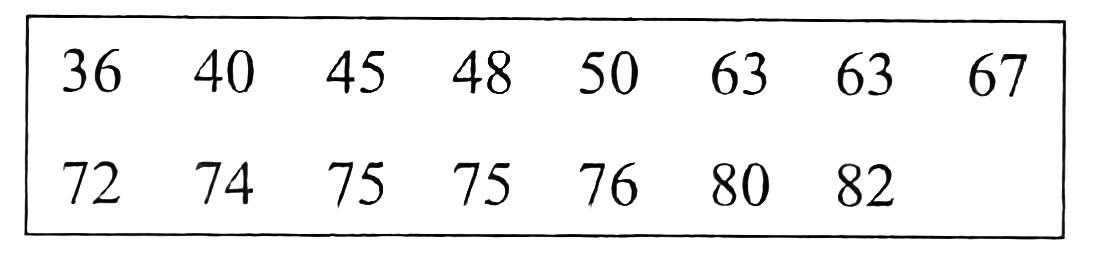
Diagram 9 shows the marks obtained by 15 students in a Mathematics test.
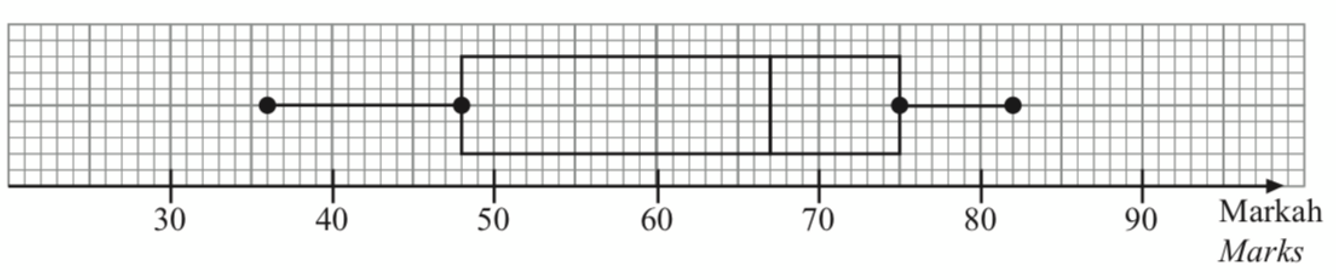
(a)(i) On the graph in the answer space, draw a box plot for these marks.
[3 marks]
(ii) Calculate the mean mark.
[2 marks]
(iii) State the distribution shape of the data.
[1 mark]
(b) The marks are adjusted by subtracting 2 marks from the current mark of each student.
A student says that the new modes and the new range will be the same as the previous data.
Is his statement correct? Justify your answer.
[2 marks]
Answer:
Answer:
(a)(i)
(a)(ii)
$$ \begin{aligned} & \text { Mean } \\ & =\frac{36+40+45+48+50+63+63+67+72+74+75+75+}{76+80+82} \\ & =\frac{946}{15} \mathrm{} \text { or } 63 \frac{1}{15} \mathrm{} \text { or } 63.07 \end{aligned} $$
(a)(iii) Left-skewed
(b)
Wrong.
New modes are 61 and 73 .
Diagram 9 shows the marks obtained by 15 students in a Mathematics test.
(a)(i) On the graph in the answer space, draw a box plot for these marks.
[3 marks]
(ii) Calculate the mean mark.
[2 marks]
(iii) State the distribution shape of the data.
[1 mark]
(b) The marks are adjusted by subtracting 2 marks from the current mark of each student.
A student says that the new modes and the new range will be the same as the previous data.
Is his statement correct? Justify your answer.
[2 marks]
Answer:
Answer:
(a)(i)
(a)(ii)
$$ \begin{aligned} & \text { Mean } \\ & =\frac{36+40+45+48+50+63+63+67+72+74+75+75+}{76+80+82} \\ & =\frac{946}{15} \mathrm{} \text { or } 63 \frac{1}{15} \mathrm{} \text { or } 63.07 \end{aligned} $$
(a)(iii) Left-skewed
(b)
Wrong.
New modes are 61 and 73 .