Example 1:
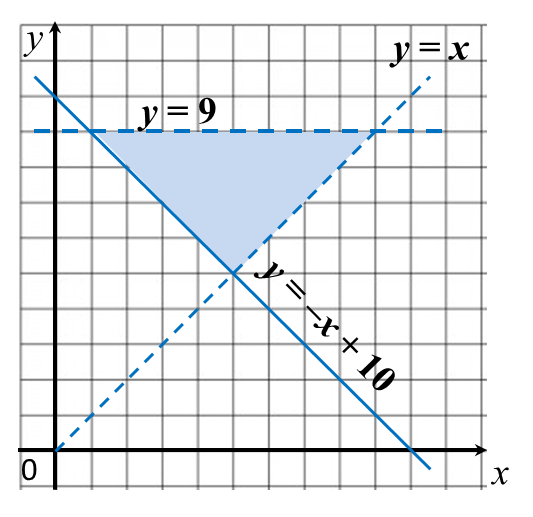
On the graph in the answer space, shade the region which satisfies the three inequalities y ≥ –x + 10, y > x and y < 9.
Answer:
Solution:
1. The region that satisfies the inequality y ≥ –x + 10 is the region on and above the line y = –x + 10.
2. The region that satisfies the inequality y > x is the region above the line y = x. Since inequality sign “ >” is used, the points on the line y = x is not included. Thus, a dashed line needs to be drawn for y = x.
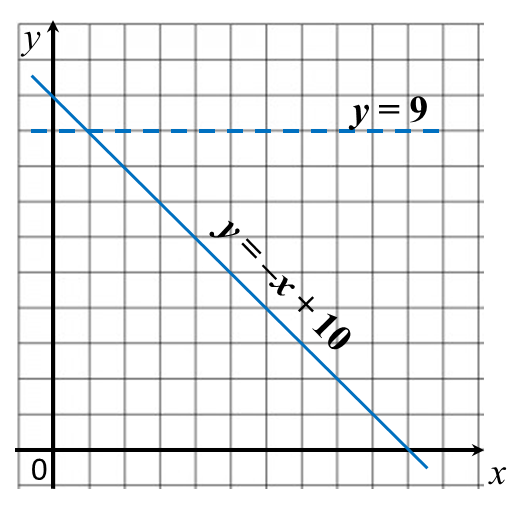
3. The region that satisfies the inequality y < 9 is the region below the line y = 9 drawn as a dashed line.
Example 2:
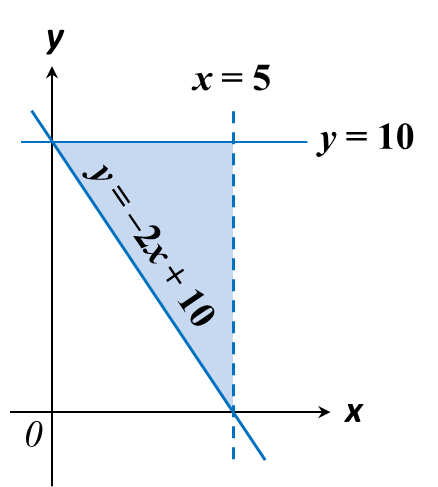
On the graph in the answer space, shade the region which satisfies the three inequalities y ≥ –2x + 10, y ≤ 10 and x < 5.
Answer:

Solution:
1. The region which satisfies the inequality of the form y ≥ ax + c is the region that lies on and above the line y = ax+ c.
2. In this question, y intercept, c = 10, x intercept is 5.
3. The region that satisfies the inequality y ≥ –2x + 10 is the region on and above the line y = –2x + 10.
4. The region that satisfies the inequality y ≤ 10 is the region on and below the line y = 10.
5. The region that satisfies the inequality x < 5 is on the left of the line x = 5 drawn as a dashed line.