6.1.1 Position of a point relative to the graph of y = ax+ b
1. When y = ax + b, the point is on the line.
2. When y < ax + b, the point is below the line.
3. When y > ax + b, the point is above the line.
6.1.2 Identifying the region satisfying the respective inequalities.
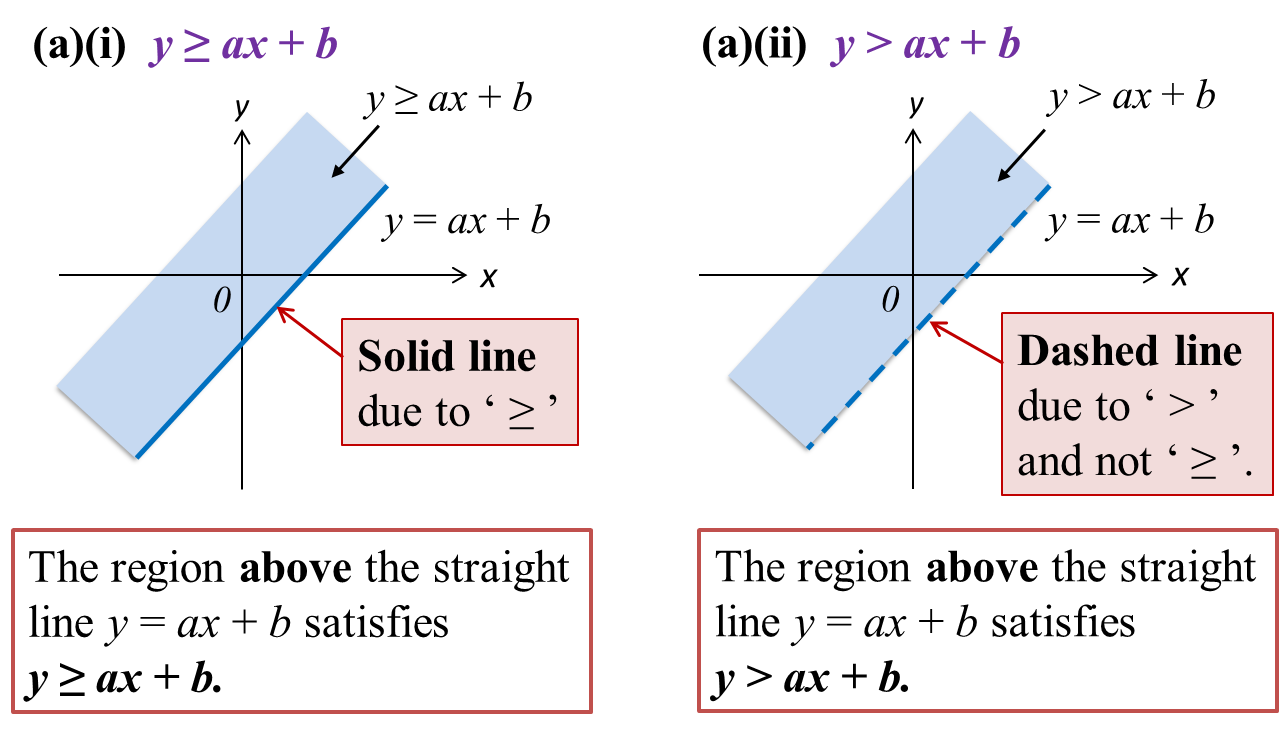
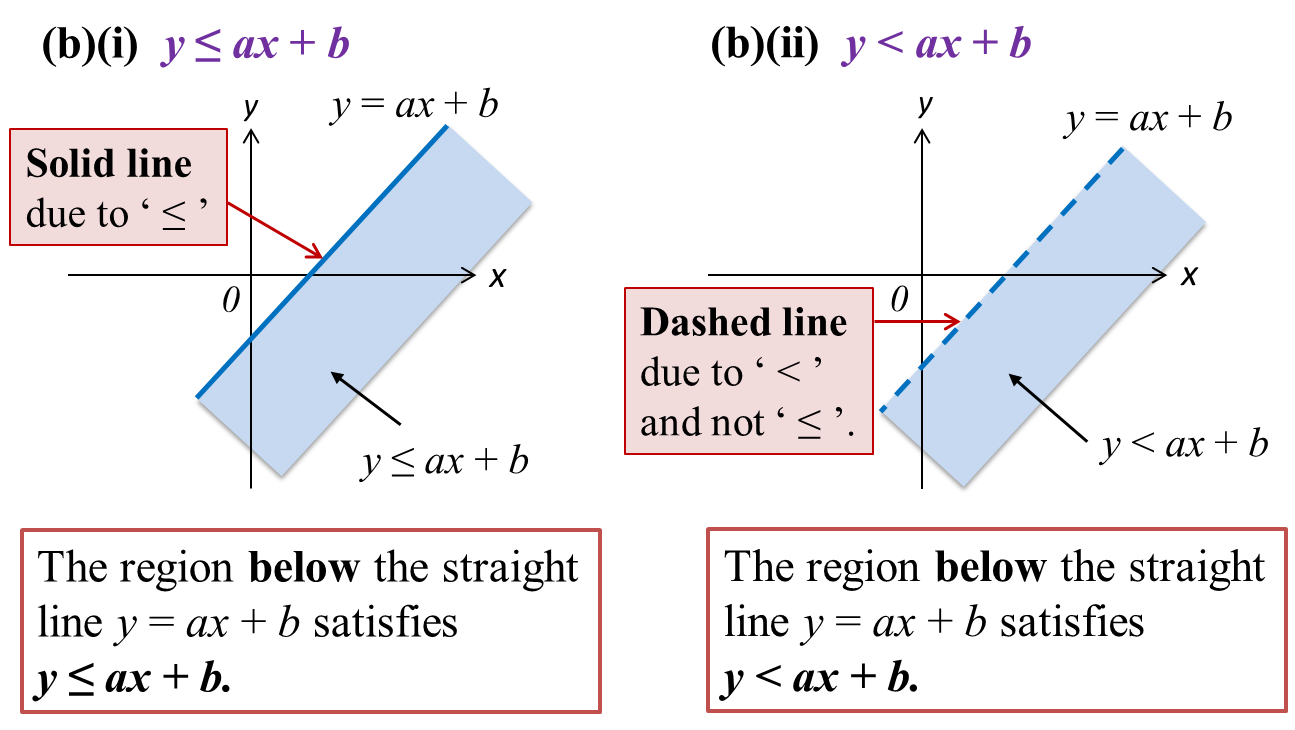
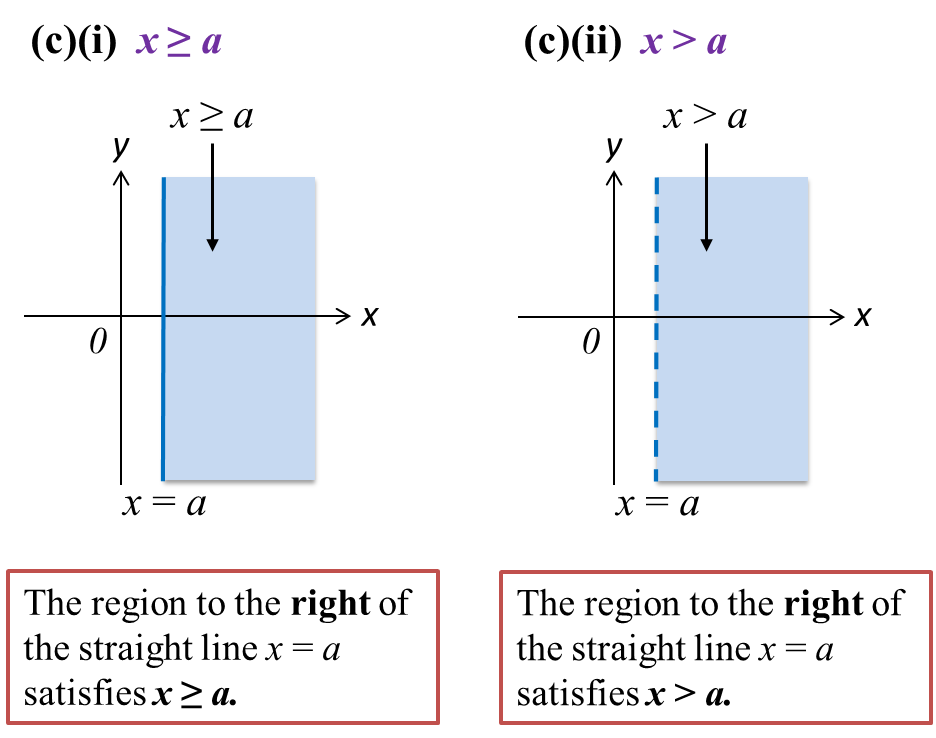
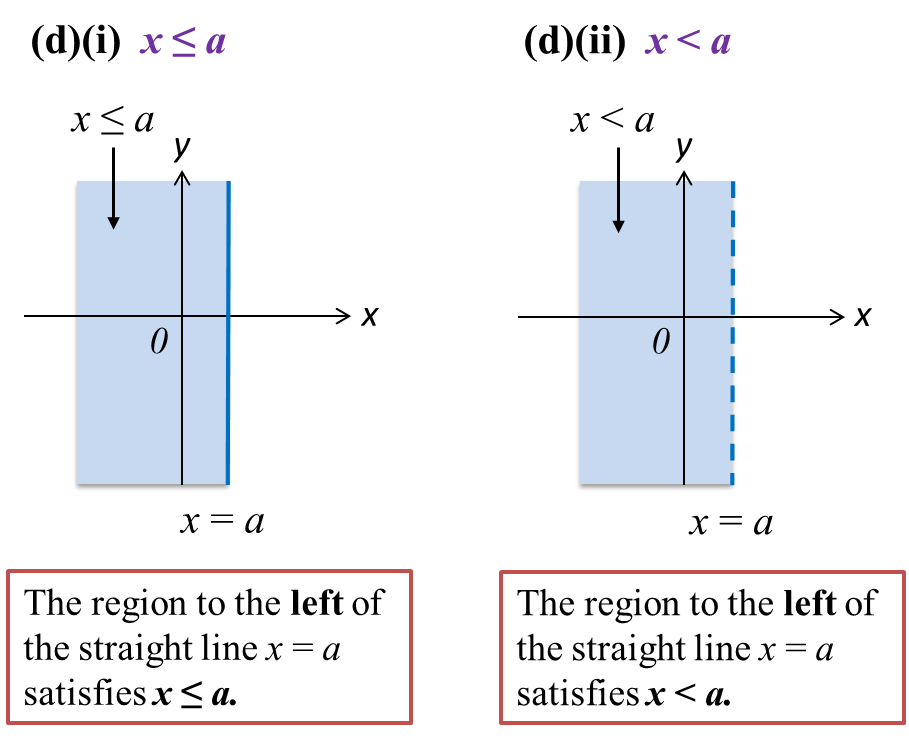
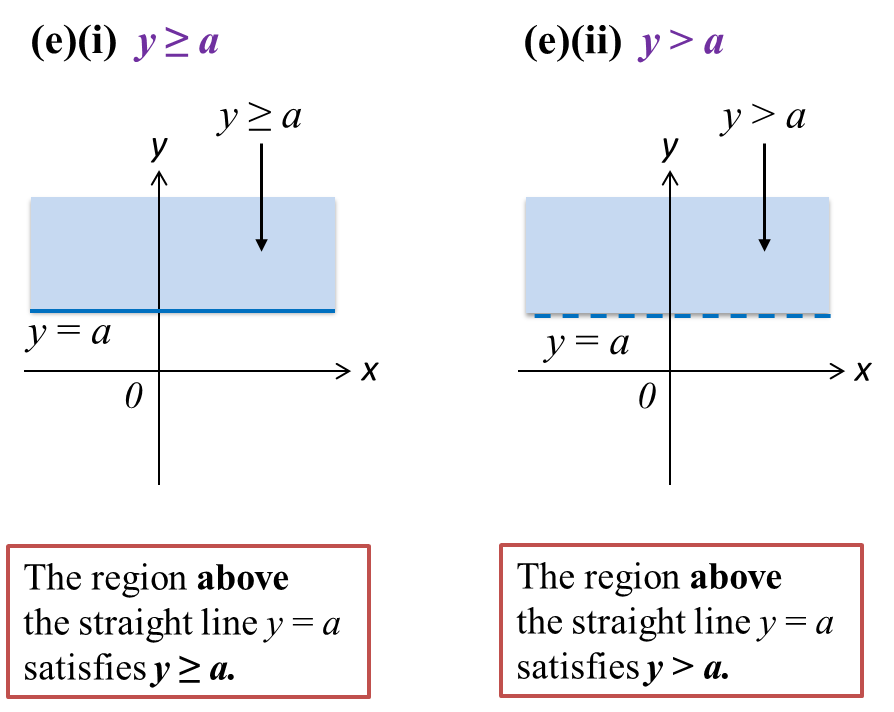
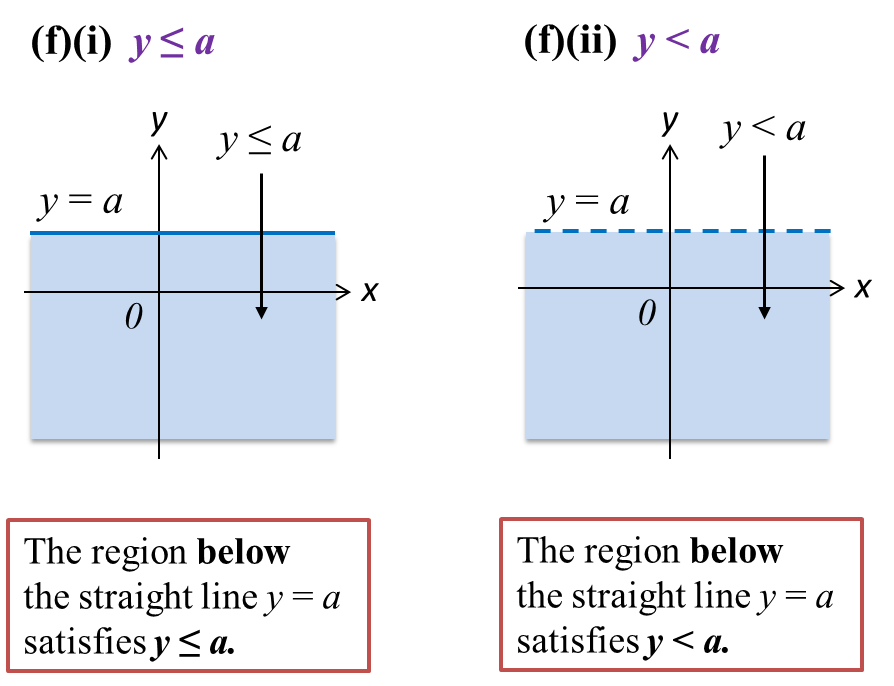
1. A dashed line ‘----’ is used when points on the line are not included in the region representing the inequality, such as y > ax + b or y < a or x > a.
2. A solid line ‘___’ is used when points on the line are not included in the region representing the inequality, such as y ≥ ax + b or y ≤ a or x ≥ a.
3. The diagrams below show the regions that satisfy the respective inequalities.