Question 5:
(a) Modal class = time 50 – 54 seconds (highest frequency).
(b)
(c)
(d)
The table below shows the frequency distribution of the time spent by 50 swimmers in the pool in a swimming practice.
Time (seconds) |
Frequency |
35 – 39 |
5 |
40 – 44 |
8 |
45 – 49 |
9 |
50 – 54 |
15 |
55 – 59 |
11 |
60 – 64 |
2 |
(a) State the modal class.
(b) Calculate the estimated mean of the time spent of a swimmer.
(c) Based on table above, complete table below in the answer space by writing down the values of the upper boundary and the cumulative frequency.
Upper Boundary |
Cumulative Frequency |
34.5 |
0 |
39.5 |
|
64.5 |
50 |
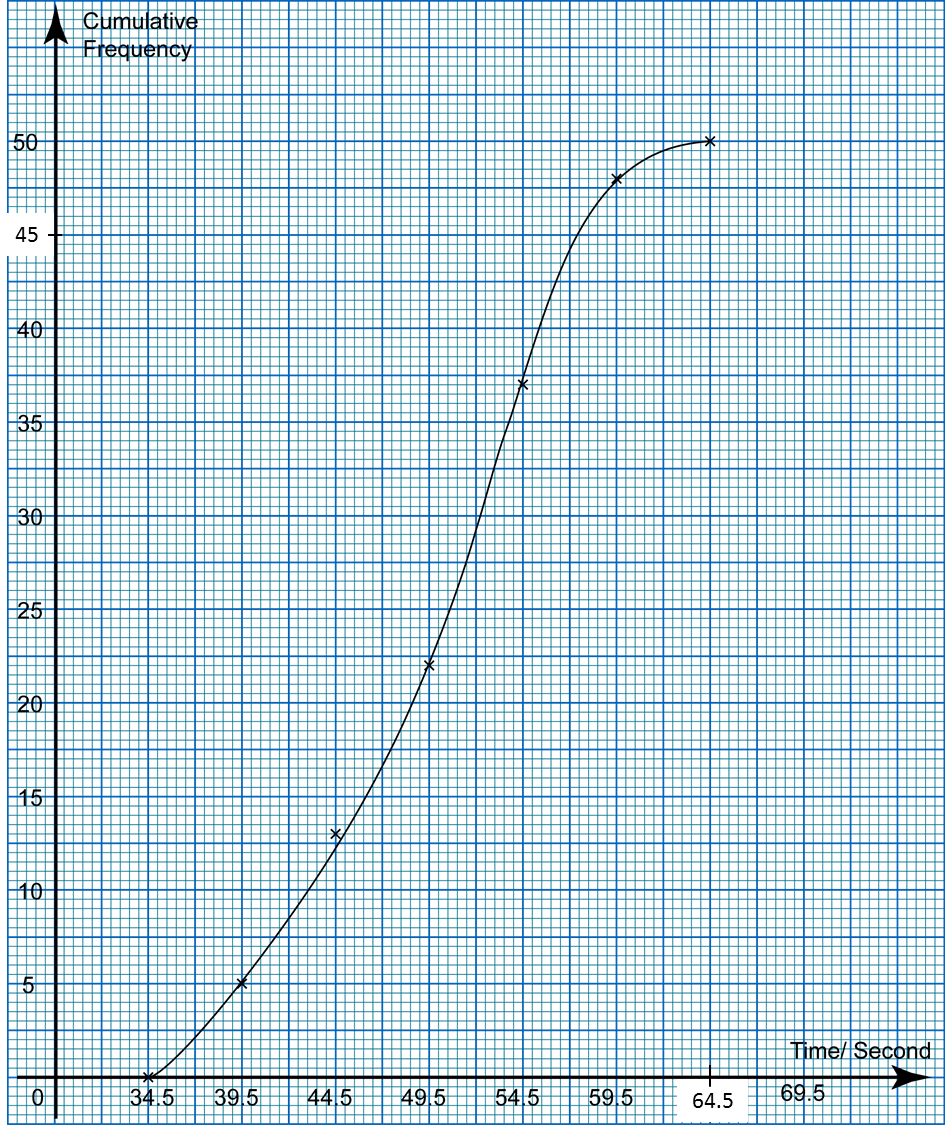
(d) For this part of the question, use graph paper. You may use a flexible curve rule.
By using a scale of 2 cm to 5 seconds on the horizontal axis and 2 cm to 5 swimmers on the vertical axis, draw an ogive for the data.
Solution:(a) Modal class = time 50 – 54 seconds (highest frequency).
(b)
(c)
Upper Boundary |
Cumulative Frequency |
34.5 |
0 |
39.5 |
5 |
44.5 |
13 |
49.5 |
22 |
54.5 |
37 |
59.5 |
48 |
64.5 |
50 |
(d)
Question 6:
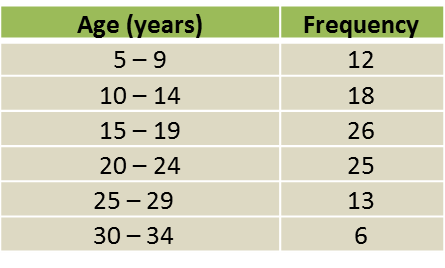
The table below shows the frequency distribution of the age of 100 scouts in a camping spot.
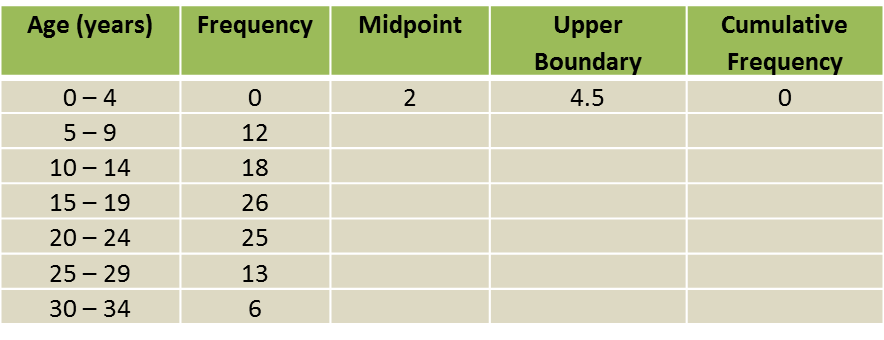
(a) Based on table above, complete table in the answer space.
(b) Calculate the estimated age, in years, of a scout in the camping spot.
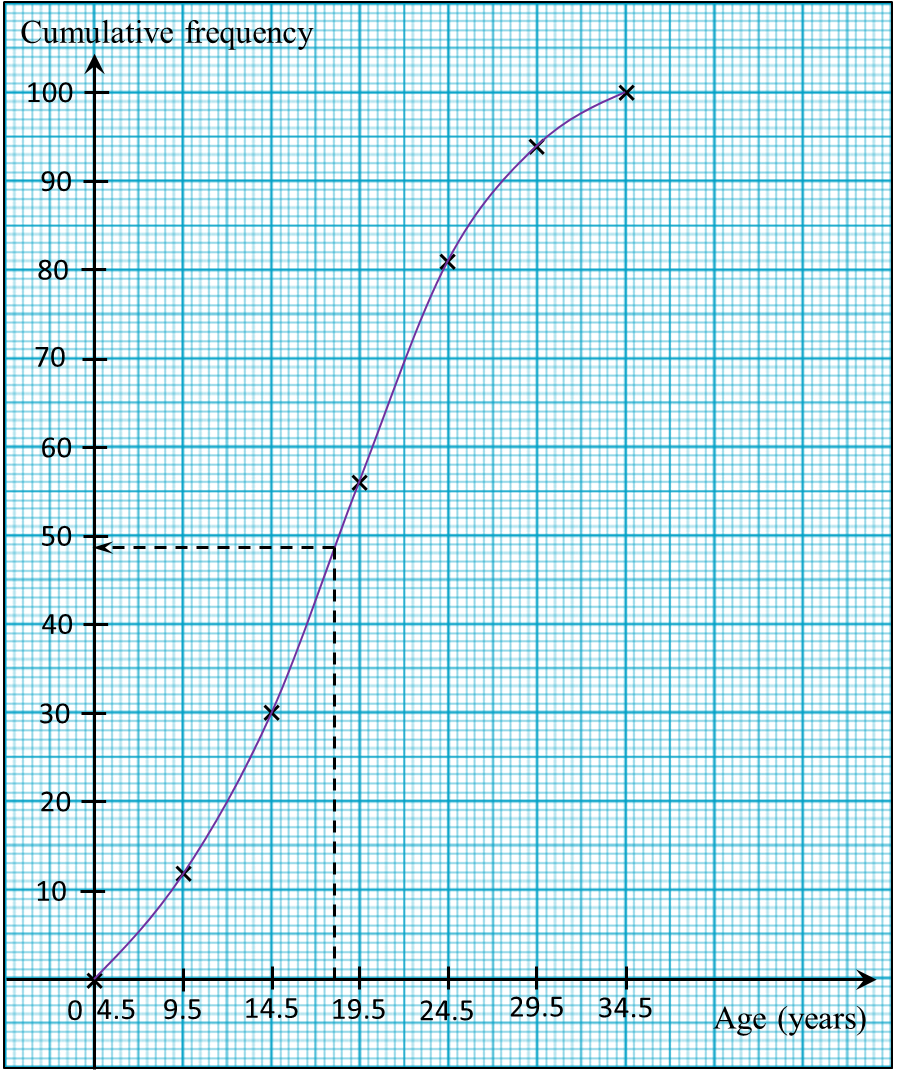
(c) For this part of the question, use graph paper. You may use a flexible curve rule.
By using a scale of 2 cm to 5 years on the horizontal axis and 2 cm to 10 scouts on the vertical axis, draw an ogive for the data.
(d) Any scout which is older than 18 years old is considered senior scout.
Based on the ogive drawn in part (c), find the percentage of senior scout in the camping spot.
Answer:
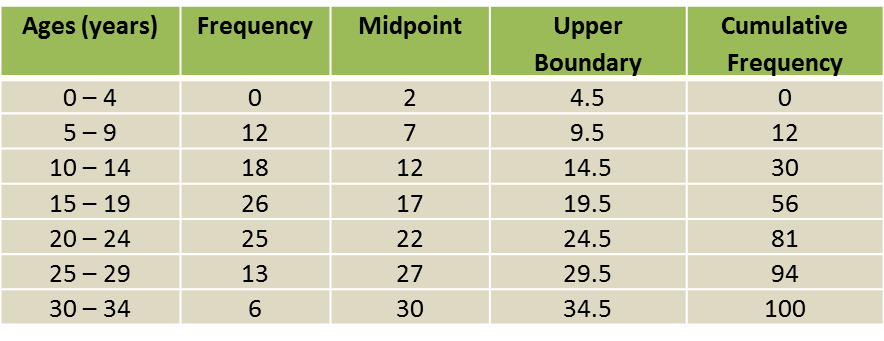
Solution:
(a)
(b)
(c)
(d)
The table below shows the frequency distribution of the age of 100 scouts in a camping spot.
(a) Based on table above, complete table in the answer space.
(b) Calculate the estimated age, in years, of a scout in the camping spot.
(c) For this part of the question, use graph paper. You may use a flexible curve rule.
By using a scale of 2 cm to 5 years on the horizontal axis and 2 cm to 10 scouts on the vertical axis, draw an ogive for the data.
(d) Any scout which is older than 18 years old is considered senior scout.
Based on the ogive drawn in part (c), find the percentage of senior scout in the camping spot.
Answer:
Solution:
(a)
(b)
(c)
(d)